To the delight of short-term traders, trade tensions resurfaced this week, injecting volatility that was felt in the major averages. The Dow, which sports key exporters, took the biggest hit on Tuesday. To a lesser extent, the broader-based S&P 500 Index, which includes a concentration of multinationals, also lost ground.
But a quick survey of other key yardsticks paints a different picture. The tech-heavy NASDAQ Composite, the Russell 2000, and the S&P 400 Mid Cap Index are all back at new highs. Small and mid-cap stocks are generally less susceptible to trade barriers. The same holds true with the uptick in the dollar and its impact on revenues.
Moreover, new highs suggest investors don’t expect a trade war to materialize, or don’t believe a series of tit-for-tat levies will have much impact on the broader economy.
One more comment—record or near record highs in the major indexes have occurred despite seven rate hikes by the Fed, and the Fed’s decision to shrink its balance sheet. The gradual upward path in rates, coupled with economic growth, and new stock buybacks, remain powerful supports.
U.S. Markets
1. Gauging inflation
- Core inflation is near the Fed’s target of 2%.
- The core CPI, which excludes food and energy, is up 2.2% over a year ago.
- The Fed-favored core PCE Price Index is up 1.8% over a year ago.
- The Fed must remain vigilant but it has accomplished its goal of price stability, as it defines price stability.
Where might core inflation be headed?
- One model, which ties the turnover of money in the economy (the velocity of M2, a broad-based measure of the money supply), suggests core inflation is likely to tick higher this year.
Figure 1: The Direction of Inflation
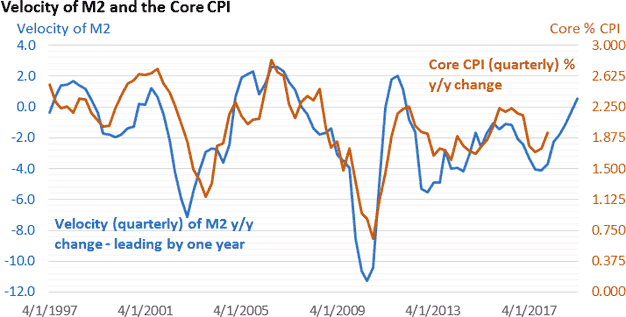
Source: St. Louis Federal Reserve
M2 is a broad-based measure of the money supply; Last Date: Q1 2018.
- The model doesn’t attempt to time any change nor does it pinpoint the magnitude of any change.
- It does illustrate that changes in the velocity of money influence inflation.
- For now, inflation remains subdued. The core CPI has come in below 0.2% (rounded to three decimal places) over the last four months and has been below 0.2% in five of the last seven months.
Inflation expectations play a big role
- Survey-based measures of inflation remain well anchored—see Figure 2.
- After holding at 2.5% for the first five months of the year, the five-year annual rate of inflation expectations has ticked up to 2.6%.
Figure 2: Anchored
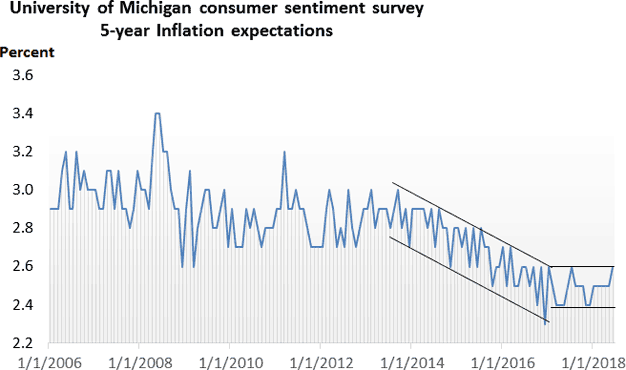
Source: University of Michigan; June 2018
2. Animal spirits stirring
- The term “animal spirits” crept back into our vocabulary early last year, as consumer and business confidence surged.
- Confidence measures are “soft” measures of economic activity. Confidence is a gauge of sentiment, but it’s practically meaningless if it doesn’t translate into real economic activity.
- One key sign that bears watching—the velocity of money.
- It not only influences price changes, it can influence economic activity.
Figure 3: As the Money Turns
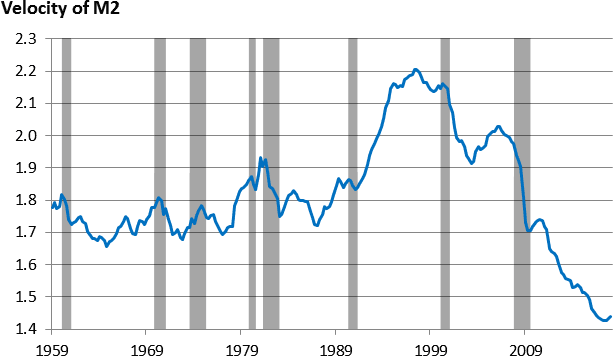
Source: St. Louis Federal Reserve, NBER
Shaded areas mark recessions; Last Date: Q1 2018
- Against the backdrop of the subpar expansion, velocity has fallen to historic lows, but finally appears to be stabilizing and turning higher.
- Money supply growth also affects economic activity; it has slowed, but the high level of confidence does appear to be translating into faster turnover, which appears set to fuel activity.
3. Another quarterly meeting, another rate hike
- No surprises from the Fed—a 25bp rate hike for the fed funds rate to 1.75%–2.00%.
- There was a slight tweak in the ‘dots,’ and the Fed now projects four rate hikes this year.
- Given the Fed’s outlook and confidence in the economy, it shouldn’t come as a surprise.
A look back—caution reigns
- Table 1 is a high-level review of the fed funds rate and two key yardsticks that measure the Fed’s progress toward its dual mandate—full employment and price stability.
- The Fed held the key lending rate at nearly zero until the jobless rate fell to 5%.
- Something that would have been unprecedented in past cycles.
- We didn’t get back above 1% until the jobless rate approached 4%.
| Table 1: A Key Policy Tool and the Fed’s Dual Mandate |
| Date |
Jobless rate |
Fed funds rate |
Core PCE Index y/y |
| Dec 2015 |
5.0% |
0.375% |
1.4% |
| Dec 2016 |
4.7% |
0.625% |
1.9% |
| Mar 2017 |
4.5% |
0.875% |
1.6% |
| Jun 2017 |
4.3% |
1.125% |
1.5% |
| Sep 2017 |
4.2% |
QT begins* |
1.4% |
| Dec 2017 |
4.1% |
1.375% |
1.5% |
| Mar 2018 |
4.1% |
1.625% |
1.8% |
| Jun 2018 |
3.8%** |
1.875% |
1.8%*** |
Source: St. Louis Federal Reserve
*QT—so-called quantitative tightening; Fed begins to shrink balance sheet
**May unemployment rate
***April core PCE Index
- The slow recovery from the deepest recession since the 1930s, a dovish/cautious Fed, and low inflation have kept policymakers from getting too aggressive.
4. Retail sales power up
- Sales surged in the wake of the hurricanes, eased when replacement spending ran its course, and have since accelerated.
- Growth in core sales, ex-autos and ex-gas stations, has been respectable—strong over the last four months.
-
Year-over-year growth in core sales is near the top (yes, we can quibble about the exact placement of the horizontal lines) of the longer-term range—see Figure 4.
Figure 4: Optimism Translates Into Faster Sales Growth
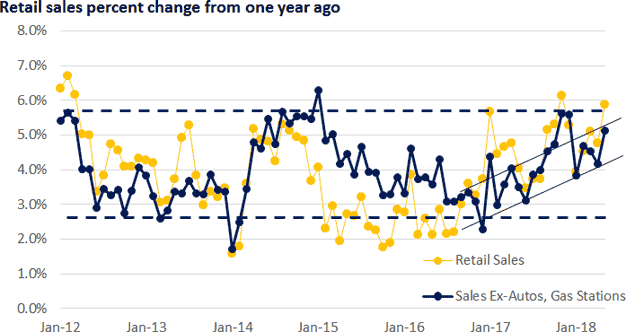
Source: U.S. Census May 2018
- Job growth, consumer confidence, and overall economic activity support retail sales.
- Tax cuts stimulus is in the pipeline.
- It increases odds a more sustained improvement in consumer spending is at hand.
Global markets
5. European slowdown
- 2017 was the year of the synchronized global expansion.
- 2018 has been greeted with a hiccup.
- The IHS Markit Eurozone Manufacturing PMI recorded a 15-month low of 55.5 in May.
- Since hitting a record high in December, it’s been down for five straight months
Figure 5: Rolling Over
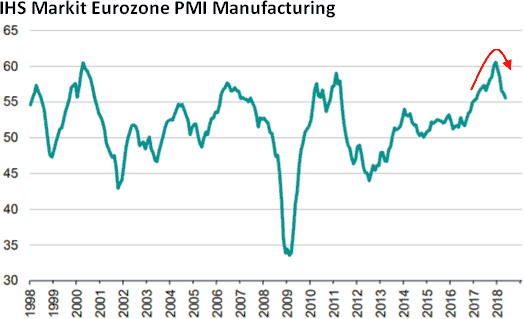
Source: IHS Markit May 2018. A reading of 50 suggests eurozone manufacturing is neither expanding nor contracting.
- European Central Bank President Mario Draghi acknowledged his concerns at the June meeting.
- Trade tensions could exacerbate the outlook, but odds growth will stall are low.
- The ECB plans to end QE by yearend.
- The ECB doesn’t plan on raising rates until at least the end of the summer of 2019.
6. A peek ahead
I. Bouncing back in Q2
- Q1 GDP expanded at an annual pace of 2.2%.
- Q2 is coming in at a much stronger pace—4.7% as of June 19, according to the Atlanta Fed’s GDPNow model.
- The model is designed to incorporate data that translates directly into GDP. It does it in real time.
Figure 6: Acceleration
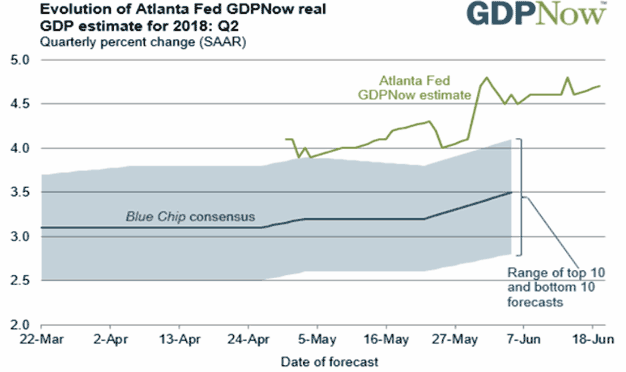
Source: Atlanta Federal Reserve as of 6.19.17
- May have not completely come in.
- June data won’t hit until next month.
- However, the upward trend in the estimate is encouraging; prior periods that started out strong have moderated.
Longer term—can Q2’s momentum be sustained?
- The economy is rebounding from a lackluster Q1.
- We’ve experienced short-term periods of strength before, only to have growth slide back.
- Looking ahead, consumer and business confidence is strong and fiscal stimulus/tax cuts are in the pipeline.
- Concerns—trade tensions.
Another view
- The Chicago Fed National Activity Index is comprised of 85 monthly economic reports.
- Like GDP, it’s a broad-based review of economic performance.
Figure 7: A Mountaintop View
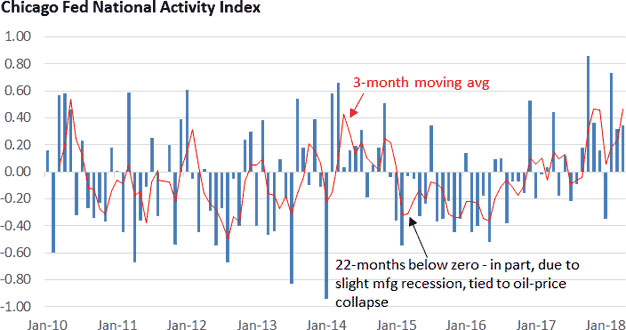
Source: St. Louis Federal Reserve as of April 2018. A reading of zero suggests the economy is expanding at its historical pace. A positive reading corresponds to above-trend growth; a negative reading corresponds to below-trend growth. The Chicago Fed believes the three-month moving provides a more consistent picture of economic growth, as it helps smooth out month-to-month volatility.
- The three-month moving average has been positive for seven consecutive months, signaling above average economic growth.
- Upward momentum is encouraging.
II. Q2 earnings on tap
- Q1 S&P 500 earnings surged 26.6% versus a year ago (Thomson Reuters I/B/E/S), the best reading since Q4 2010 when the economy was exiting the recession and y/y comparisons were easy.
- Economic growth, a weaker dollar, and corporate tax cut all lent support.
- But investors yawned, even as many firms beat by a wide margin.
Was Q1 the peak in the cycle?
- Q2 is forecast to rise 20.6%, but firms typically top analyst estimates, suggesting the current forecast may be too conservative.
- Q1 profits were forecast to rise 18.5% when the quarter ended.
- The final number highlights that analysts were far too conservative.
- Might we get a repeat in Q2?
- Strong earnings growth projected in 2018, and any upside surprises may be tempered by the view that 20%+ gains this year are unsustainable.