The year 2022 was a brutal year where very little seemed to favor the investor. So now we are into 2023, most of us are happy to put this last year behind us. In sitting down with clients during Q1, it will be helpful to have some succinct talking points, especially after the horrendous losses from the 2022 market. We include below the key questions on everyone’s mind, as well as the charts and data points to answer those questions, courtesy of our friends at The Carson Group, LPL Financial and Goldman Sachs.
1. How did portfolios do?
In a phrase, there was nowhere to hide as the bear rears its ugly head
There was literally nowhere to hide in the market, except if you were invested in energy. The energy sector delivered remarkable gains in 2022, returning more than 35% to significantly outperform every other S&P 500 sector. Indeed, no other sector gained even 5% in 2022, as the SP500 closed 2022 with a near 20% loss.
Figure 1: 2022 Returns
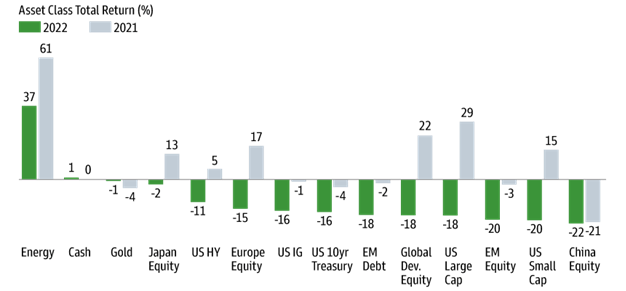
Source: Goldman Sachs Chart of the Week, 12/30/2022
The good news is that stocks historically perform well after a bear market, regardless of a recession, returning a median 26%.
Figure 2: S&P 500 Index Returns After Bear Market Entry
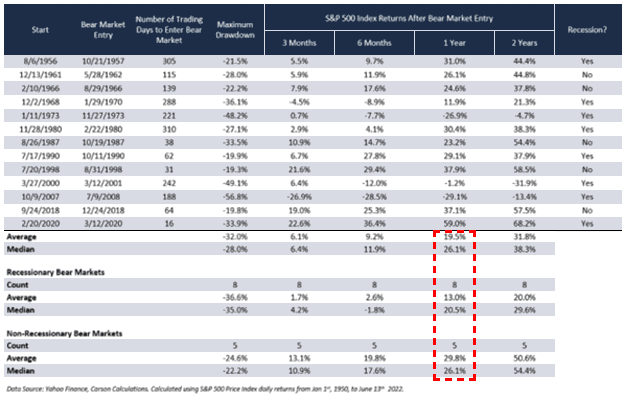
Source: Yahoo Finance, Carson Calculations, calculate using S&P 500 Price Index daily returns from January 1, 1950 to June 13, 2022.
The $65,000 question is whether the energy sector or other commodities will see continued momentum in 2023. If continued commodities strength (or continued inflation) is a house thesis for you, consider an energy or commodities fund, such as the Goldman Sachs Commodities Fund, which returned 15% in 2022.
2. But why did markets buckle?
One of the reasons that 2022 was such a challenging year was due to the extraordinary Federal Reserve rate hikes that took place. Indeed, the Federal Reserve raised interest rates seven times during 2022, at a pace that was more extreme than any other recent rate cycle, including 1983, 1987, 1994, 1999, 2004 and 2015.
The $65,000 question is ‘When will the Fed stop raising rates—and when will the Fed start cutting rates?’ Some are predicting that rate cuts will come in middle to late 2023 at the earliest (LPL), however others are predicting that rate cuts will only come in 2024. Depending on your view, it could soon be time to enter core fixed income, or you may need to wait. Either way, think about your entry point and what that looks like so you won’t miss the opportunity.
3. Do I need to worry about a recession to make things even worse?
Another question on everyone’s mind is whether a recession will be coming in 2023 and if it does, whether it will be steep or shallow. The JPMorgan Chase view is that it will be a “swamp-like” recession, shallow and not too damaging.
Beyond JPM, there is a general consensus that there could be a recession in 2023, although Goldman Sachs stands outside consensus in predicting that there will be no recession this year. Should the economy avoid a recession, the bear market typically bottoms at -23.8% with an average duration of seven months.
Figure 3: Historic Bear Market Duration and Losses
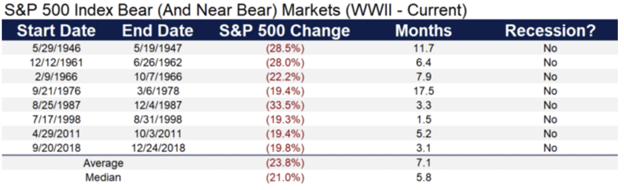
Source: LPL Research, FactSet 5/13/2022. All indexes are unmanaged and cannot be invested into directly. Past performance is no guarantee of future results. The modern design of the S&P 500 stock index was first launched in 1957. Performance back to 1950 incorporates the performance of the predecessor index, the S&P 90.
Most do believe, however, that in the event a recession does occur, it may be mild because of the strength of the consumer and generally healthy labor markets (LPL). Should recession hit, bear markets get worse, returning -34.8% on average and lasting nearly 15 months.
Figure 4: Bear Markets Worsen With Recession
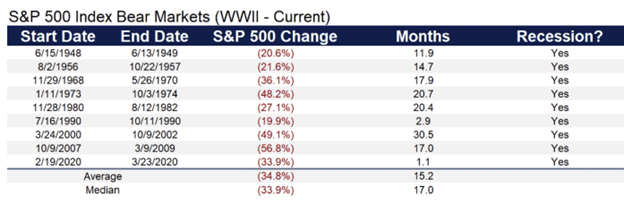
Source: LPL Research, FactSet 5/13/2022. All indexes are unmanaged and cannot be invested into directly. Past performance is no guarantee of future results. The modern design of the S&P 500 stock index was first launched in 1957. Performance back to 1950 incorporates the performance of the predecessor index, the S&P 90.
Taking a step back and reviewing all bear markets since WWII, there have been 18, lasting and an average of 11 months and with an average loss of -29.6%.
Figure 5: Bear Markets Last About a Year
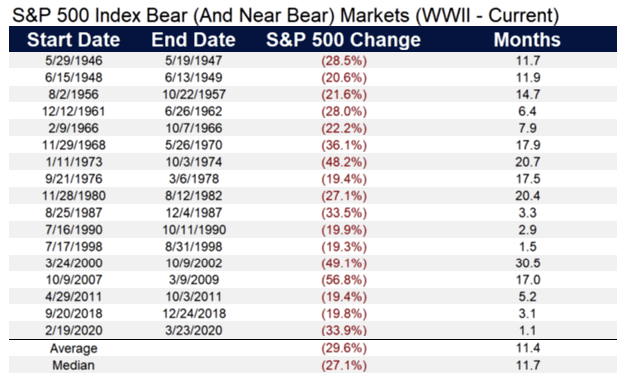
Source: LPL Research, FactSet 5/3/2022. All indexes are unmanaged and cannot be invested into directly. Past performance is no guarantee of future results. The modern design of the S&P 500 stock index was first launched in 1957. Performance back to 1950 incorporates the performance of the predecessor index, the S&P 90.
The $65,000 question is whether we will have a recession in 2023, and more importantly, will it be a steep recession causing more market declines or shallow? Depending on your view, if you believe the former, then you may want to continue holding cash, hedging and lightening up on equities. If you are believing it is the latter, then advising clients to stay the course or even buying equities on minor dips may make sense.
Figure 6: Investing With Recession Risk
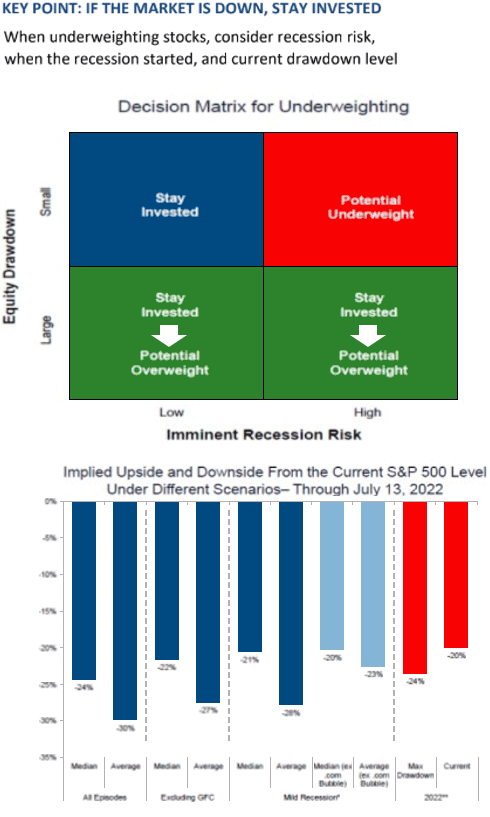
Source: Goldman Sachs Investment Strategy Group, Goldman Sachs Asset Management and Bloomberg. As of July 13, 2022.
*Mild recession assumes 2% decline in real GDP.
**2022 is measure from peak on January 3 to trough on June 15.
4. What happened to bonds? And to the 60/40 portfolio?
One of the other reasons that 2022 was so difficult for investors is that bonds did not provide any ballast to a declining equity market. Indeed, both bonds and stocks suffered double-digit losses during 2022. According to LPL, only four other times since inception has the Bloomberg Aggregate Bond Index realized a negative calendar year return, with 2022 realizing the worst year by far. The previous worst year on record was 1994 with a -2.9% loss, far better than 2022’s total loss of about -13%.
Pulling this all together, therefore, shows that the 60/40 portfolio suffered a tremendous amount of damage in 2022 as these negative returns were completely unexpected. Indeed, since the inception of the Agg, the S&P 500 and the Agg have never been negative in the same calendar year. Not only did that happen in 2022, but it was also the third worst year for stocks and the worst year for the Agg since its inception in 1976. And when you put both losing investments together, BANG! A 60/40 portfolio is down -17% for 2022, second only to 2008 for the worst year for a balanced portfolio since the Agg was created in 1976.
Figure 7: The 60/40 Portfolio Suffered Second-Worst Year Since 1976
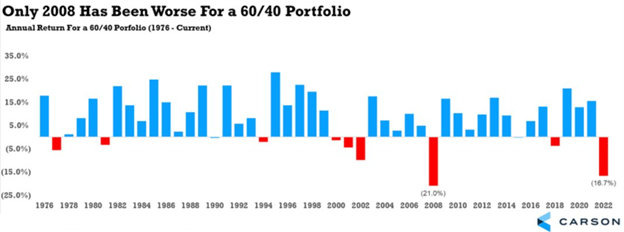
Source: Carson Investment Research, YCharts 12/29/22 (1976–current). 60/40 portfolio consists of 60% in the S&P 500 Index and 40% in the Bloomberg U.S. Aggregate Bond Fund.
The $65,000 question is whether the 60/40 portfolio is dead? We do not believe that to be the case. Looking forward, many are predicting that the 60/40 portfolio will come back to life and provide strong returns. At nearly one year old, the current bear market is now longer than the average post-World War II bear (11 months). And at the October S&P 500 lows, the 25% peak-to-trough decline was larger than the average non-recession bear market decline since World War II (-23.8%) and 4% shy of the average decline for all post-World War II bear markets (-29.4%).
Keep in mind that the market does have an upward bias (positive in 32 out of 43 years) and it does recover after a bear market. Indeed, the & Index spends 4x more days in a bull market than a bear market, with an average bull market return of 209% versus the average bear market return of -38%.
Figure 8: Stocks Spend More Time in Bull Markets and Gain an Average of 209%
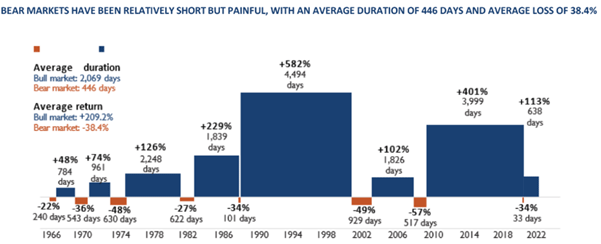
Source: Schwab Center for Financial Research with data provided by Bloomberg. Data as of 12/31/2022. The market is represented by daily price returns of the S&P 500 Index. The S&P 500 Index is generally considered representative of the US stock market. Bear markets are defined as periods with cumulative declines of at least 20% from the previous peak close. Its duration is measured as the number of days from the previous peak close to the lowest close reached after it has fallen at least 20%, and includes weekends and holidays. Periods between bear markets are designated as bull markets. Past performance is no guarantee of future results.
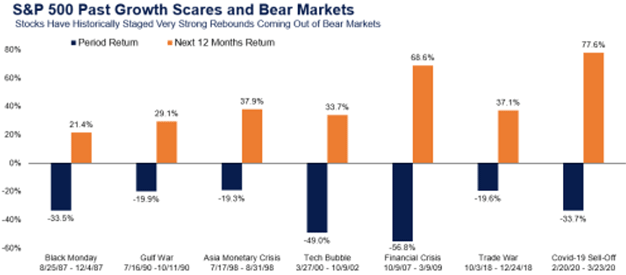
The S&P 500 has bounced back an average of more than 20% within 12 months coming out of bear markets. Looking at just the last seven bear markets since the 1987 crash, the market has bounced back an average of 43.6% after dropping -33.1%.
Figure 9: Bouncing Back After Bears
Source: LPL Research, FactSet 12/27/2022. All indexes are unmanaged and cannot be invested into directly. Past performance is no guarantee of future results. The modern design of the S&P 500 stock index was first launched in 1957. Performance back to 1950 incorporates the performance of the predecessor index, the S&P 90.
5. Do politics and Washington elections have anything to do with this?
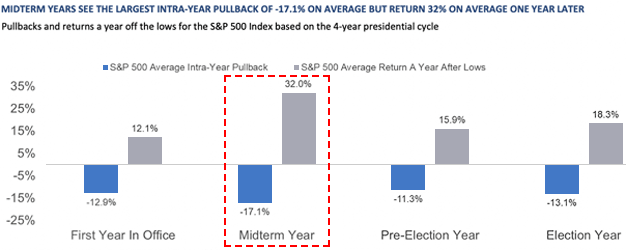
There is no question that midterm years are brutal, but it typically gets better from here. Generally speaking, the average midterm year has an intra-year -17.1% loss, and a 32% return a year after the lows.
Figure 10: Midterm Years Do Tend to Be Tough
Source: LPL Research, FactSet 1/11/2022 (1950–2022). All indexes are unmanaged and cannot be invested into directly. Past performance is no guarantee of future results. The modern design of the S&P 500 stock index was first launched in 1957. Performance back to 1950 incorporates the performance of the predecessor index, the S&P 90.
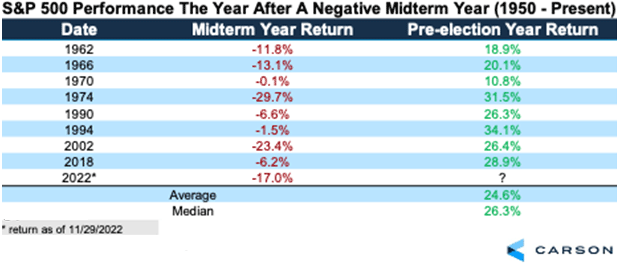
When the S&P 500 is lower during a midterm year (like we saw in 2022), the following year has been extremely strong. Since 1950, the year after a negative midterm year saw the S&P 500 higher all eight times, with a very impressive yearly return of 24.6%. Looking at the past 50 years, things are even better, as the ‘worst’ next year was 26.3%.
Figure 11: A Bad 2022=Hope for 2023
Source: Carson Investment Research, FactSet 12/27/22 @ryandetrick
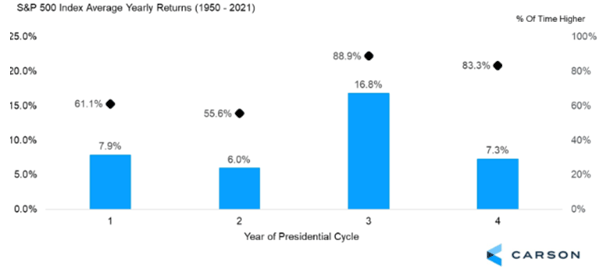
Building on the sentiment above, pre-election years historically are very strong for stocks, with the S&P 500 up 16.8% on average and higher 88.9% of the time. Midterm years are the worst, which clearly played out last year.
Figure 12: Year 3 of Presidential Cycles Is the Strongest
Source: Carson Investment Research, FactSet 11/22/22 (1960–2021)
The $65,000 question is whether you think the pre-election year of 2023 is going to follow the pattern and provide strong returns?If so, then again, the best advice will be to stay the course. And for clients who want to enter into the damaging game of trying to “time the market,” this is a good time to remind them that the best days are often coupled with the worst days. There will be no good time to enter the fray. A lot of the positive returns may happen quickly and without notice, with investors missing out on 25% of their returns if they missed the five best days over a 20-year period.
Figure 13: Market Timers Miss Out. Period.
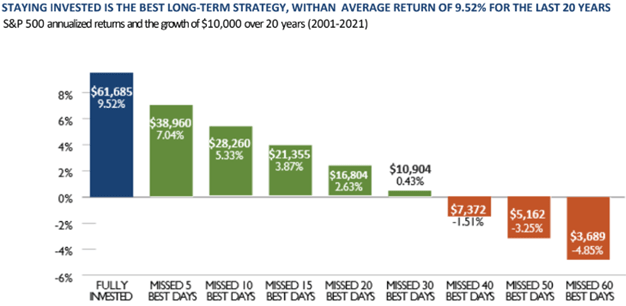
Source: The S&P 500 Index is generally considered representative of the US stock market. Past performance is no guarantee of future results.
6. And finally, how often do we have back-to-back negative years?
The good news is that the market has only experienced two periods of back-to-back negative years since WWII.
Figure 14: 2 Negative Years in a Row—Not Likely
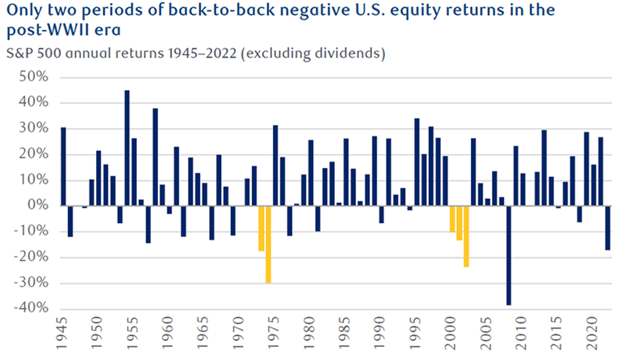
Source: RBC Wealth Management, Bloomberg; 2022 represents preliminary year-to-date through 11/21/22.
All in all, that’s something for bulls to look forward to in 2023.