The year began on an upbeat note. Economic growth was steady and appeared set to accelerate, the unemployment rate had fallen to a 50-year low, interest rates were steady, and corporate profit growth was projected to quicken.
While the prospect for a phase-two trade deal with China was far from certain, President Trump and Chinese Vice Premier Liu He signed a phase-one trade accord designed to ease tensions and begin to level the playing field between the two economic powers.
All the ingredients were in place for a good year. Tailwinds for favorable sentiment hadn’t gone unnoticed by investors, who pushed stocks to new highs early in the year.
As we enter the second half of 2020, January’s upbeat mood seems like another era. The world has changed dramatically due to the spread of the novel coronavirus.
As cases began to rise in the U.S., state and local governments ordered lockdowns and announced shelter-in-place orders. Many businesses deemed ‘non-essential’ were temporarily closed, and the longest expansion in U.S. history came to a screeching halt.
In June, the National Bureau of Economic Research announced that the record-long expansion ended in February and the U.S. economy had entered a recession.
“The usual definition of a recession involves a decline in economic activity that lasts more than a few months. However…the NBER recognizes that the pandemic and the public health response have resulted in a downturn with different characteristics and dynamics than prior recessions,” the Committee said.
“Nonetheless, it concluded that the unprecedented magnitude of the decline in employment and production…warrants the designation of this episode as a recession, even if it turns out to be briefer than earlier contractions.”
The economic data in April can arguably be described as catastrophic amid record layoffs and furloughs. May and June’s rebound (in instances where we’ve received June economic reports) have been cautiously encouraging, with the numbers far exceeding expectations in many cases.
That said, the short-term damage to the economy has been widespread. Climbing out of a deep pit will take time. And the outlook remains unusually uncertain amid a spike in new cases across many states.
A rollercoaster
Investor reaction to the crisis was unusually swift. The S&P 500’s peak to 10%, peak to 20%, and peak to 30% declines occurred in record time, as investor discounted an unparalleled drop in economic activity.
Recognizing that a health care crisis could quickly morph into a financial crisis, the Federal Reserve wasted little time in responding, using its extraordinary powers as lender of last resort. Coupled with massive fiscal stimulus from the Federal government, the major indexes staged an impressive rally. However, not all sectors have benefited—see Table 4.
By the end of June, the DJIA was down nearly 10% YTD, the S&P 500 Index was down just 4.0%, while the tech-heavy NASDAQ Composite is up a solid 12.1%, as investors have taken refuge in sectors seen as less vulnerable to the Covid-inspired crisis.
Given the severity of the downturn and the extraordinarily uncertain outlook, the damage to the major indexes has been surprisingly modest. Fed action and expected economic recovery has supported equities.
The unknown path of the virus, the timing of a vaccine or effective treatment, and a possible second wave in the fall and next winter remain risks.
| Table 1: Stock Index Performance |
| Index |
YTD % |
| Dow Jones |
| Dow Jones Industrial Avg |
-9.6 |
| Transportation Average |
-15.9 |
| Utility Average |
-12.7 |
| 65 Composite |
-11.7 |
| Total Stock Market |
-4.4 |
| NASDAQ |
| NASDAQ Composite |
12.1 |
| Nasdaq 100 |
16.3 |
| Biotech |
13.5 |
| Standard & Poor’s |
| S&P 500 Index |
-4.0 |
| 100 Index |
-1.0 |
| MidCap 400 |
-13.6 |
| SmallCap 600 |
-18.5 |
| SuperComp 1500 |
-5.0 |
| Other U.S. Indexes |
| NYSE Composite |
-14.5 |
| Russell 1000 |
-3.7 |
| Russell 2000 |
-13.6 |
| Russell 3000 |
-4.4 |
| PHLX Gold/Silver |
20.8 |
| PHLX Oil Service |
-57.4 |
| PHLX Semiconductor |
7.9 |
| CBOE Volatility |
120.8 |
| KBW Bank |
-34.3 |
| Value Line (Geometric) |
-19.8 |
Sources: FactSet, Dow Jones Market Data
Through 6.30.20
A coronavirus smackdown on earnings
Earnings growth slowed considerably in 2019, as the impact from the 2018 cut in the corporate tax rate faded, economic growth moderated, and margin pressures conspired against earnings.
Projections were quite favorable as the year began, but a health crisis that morphed into an economic crisis took a big toll in Q1 earnings.
Since many firms have abandoned guidance amid a very murky economic outlook, visibility going forward remains quite limited.
Analysts expected S&P 500 earnings to fall 44% year-over-year in Q2, 25% in Q3, and 13% in Q4 before rebounding by 12% in Q1 and 70% in Q2 (Refinitiv as of 7/8/2020). Current projections are subject to a wide range of outcomes. Nonetheless, the forecast for a 2021 profit recovery has played a role in aiding stocks.
| Table 2: S&P 500 Operating Earnings |
| Date |
Percent change vs. 1 year ago |
| Q1 2017 |
15.3 |
| Q2 2017 |
12.3 |
| Q3 2017 |
8.5 |
| Q4 2017 |
14.8 |
| Q1 2018 |
26.6 |
| Q2 2018 |
24.9 |
| Q3 2018 |
28.4 |
| Q4 2018 |
16.9 |
| Q1 2019 |
1.6 |
| Q2 2019 |
3.2 |
| Q3 2019 |
-0.3 |
| Q4 2019 |
3.1 |
| Q1 2020 |
-12.8 |
Source: Refinitiv
Corporate stock buybacks rise in Q1, but the recession diminishes the outlook
Companies posted the third consecutive quarter of increased buybacks, returning nearly $200 billion, as the U.S. economic impact from Covid-19 was just beginning.
For the quarter, S&P 500 companies spent $198.7 billion on buybacks, up 9.4% from Q4 2019, but down 3.4% from last year’s Q1 2019 expenditure of $205.8 billion.
S&P 500 Q1 2020 dividends set a quarterly record, rising to $127.0 billion, up 8.2% from Q1 2019. For the 12-month period, dividends set a record with $495.1 billion, up 6.6% from the corresponding prior period’s $464.4 billion.
Total shareholder return of buybacks and dividends for the quarter came in at $325.7 billion, the second largest in history (Q4 2018 was $342.8 billion).
| Table 3: S&P 500 Return of Capital |
| |
Operating earnings |
Stock buybacks |
Cash dividends |
| Q1 2020 |
$161.6 billion |
$198.7 billion |
$127.0 billion |
| Q4 2019 |
324.4 |
181.6 |
126.4 |
| Q3 2019 |
330.4 |
175.9 |
123.1 |
| Q2 2019 |
333.3 |
165.5 |
118.7 |
| Q1 2019 |
316.6 |
205.8 |
117.3 |
| Q4 2018 |
293.8 |
223.0 |
119.8 |
| Q3 2018 |
349.0 |
203.8 |
115.7 |
| Q2 2018 |
327.5 |
190.6 |
111.6 |
| Q1 2018 |
311.3 |
189.1 |
109.2 |
| Q4 2017 |
288.9 |
137.0 |
109.5 |
| Q3 2017 |
268.4 |
129.2 |
105.5 |
| Q2 2017 |
261.4 |
120.1 |
104.1 |
| Q1 2017 |
247.3 |
133.2 |
100.9 |
| Q4 2016 |
240.1 |
135.3 |
103.8 |
| 9/30/2016 |
248.0 |
112.2 |
98.4 |
| 6/30/2016 |
222.8 |
127.5 |
98.3 |
| 3/31/2016 |
209.0 |
161.4 |
96.7 |
Source: S&P Dow Jones Indexes
|
Table 3a: S&P 500 Return of Capital Annual
|
| |
Operating earnings |
Stock buybacks |
Cash dividends |
| 2019 |
$1,304.6 billion |
$728.7 billion |
$485.5 billion |
| 2018 |
1,281.7 |
806.4 |
456.3 |
| 2017 |
1,066.0 |
519.4 |
419.8 |
| 2016 |
919.9 |
536.4 |
397.2 |
Source: S&P Dow Jones Indexes
“Covid-19 has significantly changed the [buyback landscape for] Q2 2020 and forward, as companies have moved quickly to protect their liquidity via reduced and suspended buybacks and dividends,” said Howard Silverblatt, Senior Index Analyst at S&P Dow Jones Indexes. He added that all corporations will be cautious about buybacks due to economic and political concerns.
Buybacks are taking a backseat as new priorities include liquidity and reopening shuttered operations.
Key S&P 500 sectors—a wide range of returns
Technology has been the big winner in this recession. In fact, if the only data point we had was the 14.2% rise in info technology, there would be no reason to suspect that a crisis had occurred. Of course, that is not the case!
Amazon, which is the biggest component of consumer discretionary, has aided the sector. Through the end of the first half of the year, Amazon has advanced by 49.2% through June 30 (Yahoo Finance).
But as Table 4 reflects, there has been a wide range of returns. Notably, cyclicals have performed poorly, and financials are down sharply this year.
While the yield curve is no longer inverted, the curve remains shallow. Moreover, the unemployment rate is high, aggregate demand is down, and investors are attempting to price in an expected steep rise in loan losses by the banks.
| Table 4: Standard & Poor’s Key U.S. Sectors |
| Category |
YTD*% |
| Info tech |
14.2 |
| Consumer discretionary |
6.6 |
| Communication services |
-1.0 |
| Health care |
-1.7 |
| S&P 500 Index |
-4.0 |
| Consumer staples |
-7.1 |
| Materials |
-8.0 |
| Real estate |
-10.0 |
| Utilities |
-12.6 |
| Industrials |
-15.5 |
| Financials |
-24.6 |
| Energy |
-37.0 |
Source: StockCharts
Through 6.30.20
Around the world
The impact from the Covid-19-induced global recession has not been lost in international markets. While shares around the globe have rallied from prior lows, most international indexes have not fared as well as major U.S. indexes such as the NASDAQ and the S&P 500.
| Table 5: Global Indexes |
| |
YTD % |
| The Global Dow (World) |
-13.23 |
| DJ Global ex U.S. (World) |
-11.77 |
| Asia Pacific |
| Asia Dow |
-10.8 |
| All Ordinaries (Australia) |
-11.8 |
| S&P/ASX 200 (Australia) |
-11.8 |
| H-Share Index (China) |
-12.6 |
| Shanghai Composite (China) |
-2.2 |
| Shenzhen Composite (China) |
14.7 |
| Hang Seng (Hong Kong) |
-13.4 |
| S&P BSE Sensex (India) |
-15.4 |
| S&P CNX Nifty (India) |
-15.3 |
| JSX Index (Indonesia) |
-22.1 |
| Nikkei 225 (Japan) |
-5.8 |
| FTSE Bursa Malaysia KLCI (Malaysia) |
-5.5 |
| S&P/NZX 50 (New Zealand) |
-0.4 |
| PSEi index (Philippines) |
-20.6 |
| Kospi (South Korea) |
-4.1 |
| Straits Times (Singapore) |
-19.6 |
| SET (Thailand) |
-15.2 |
| Europe |
| The Global Dow (World) |
-13.2 |
| DJ Global ex U.S. (World) |
-11.8 |
| Europe Dow |
-17.9 |
| Euro Stoxx |
-12.7 |
| Stoxx Europe 600 |
-13.4 |
| ATX (Austria) |
-29.5 |
| Bel-20 (Belgium) |
-15.9 |
| OMX Copenhagen (Denmark) |
9.4 |
| OMX Helsinki (Finland) |
-6.7 |
| CAC 40 (France) |
-17.4 |
| DAX (Germany) |
-7.1 |
| Athex Composite (Greece) |
-30.3 |
| FTSE MIB (Italy) |
-17.6 |
| AEX (Netherlands) |
-7.4 |
| OBX Index (Norway) |
-15.8 |
| PSI 20 (Portugal) |
-15.8 |
| RTS Index (Russia) |
-21.7 |
| IBEX 35 (Spain) |
-24.3 |
| OMX Stockholm 30 (Sweden) |
-5.0 |
| Swiss Market (Switzerland) |
-5.4 |
| BIST 100 (Turkey) |
1.8 |
Sources: Factset; Dow Jones Market thru 6.30.20
| Table 6: Other Global Indexes |
| |
YTD% |
YTD (%) in local currencies |
| MSCI EAFE |
-12.6 |
-11.8 |
| MSCI World |
-6.6 |
-6.2 |
| MSCI World Ex-U.S.A. |
-12.7 |
-11.6 |
| MSCI EM |
-10.7 |
-6.5 |
Source: MSCI.com
Through 6.30.2020
Growth and large-cap take top honors
During the long-running expansion of the last decade, investors favored growth stocks at the expense of value. The trend has continued during the recession and subsequent rally in stocks since the near-term bottom in March.
Notably, the outperformance this year of growth versus value is significant, as investors have found shelter in faster-growing companies.
This is not your typical recession. Growth sectors that might otherwise suffer during an economic contraction have, at least up until this point, been viewed as a refuge from the economic storm clouds spewed by the Covid-19 virus.
Separately, Treasury funds are sporting positive returns this year amid the decline in interest rates. Corporate bonds, which are subject to credit risk, have also posted positive returns, as intervention in the corporate credit market by the Fed has lent support.
High-yield debt is in negative territory, but performance would likely be much worse had the Fed not signaled it would purchase ETFs that hold junk bonds.
| Table 7: ETF Performance |
| |
YTD % |
1-year annualized change % |
3-year annualized change % |
5-year annualized change % |
| U.S. equity ETFs |
| iShares S&P 500 Growth ETF |
7.81 |
17.53 |
16.54 |
14.43 |
| iShares Core S&P 500 ETF |
-3.09 |
7.48 |
10.69 |
10.69 |
| iShares S&P 500 Value ETF |
-15.55 |
-4.62 |
3.59 |
5.83 |
| |
| iShares Russell Mid-Cap Growth ETF |
4.04 |
11.64 |
14.50 |
11.36 |
| iShares Core S&P Mid-Cap ETF |
-12.80 |
-6.73 |
2.34 |
5.16 |
| iShares Russell Mid-Cap Value ETF |
-18.16 |
-11.98 |
-0.71 |
3.13 |
| |
| iShares S&P Small-Cap 600 Growth ETF |
-11.69 |
-5.94 |
3.85 |
6.40 |
| iShares Core S&P Small-Cap ETF |
-17.84 |
-11.26 |
0.57 |
4.47 |
| iShares S&P Small-Cap 600 Value ETF |
-24.39 |
-17.41 |
-3.27 |
2.05 |
| Global Equity ETFs |
| iShares Core MSCI Total Intl Stock ETF |
-11.16 |
-4.65 |
1.14 |
2.50 |
| iShares Europe ETF |
-12.76 |
-6.89 |
-0.20 |
1.18 |
| iShares Latin America 40 ETF |
-36.00 |
-34.57 |
-8.32 |
-3.90 |
| iShares Asia/Pacific Dividend ETF |
-22.61 |
-20.81 |
-6.90 |
-1.73 |
| iShares MSCI Emerging Markets ETF |
-10.01 |
-3.95 |
1.31 |
2.28 |
| Bond ETFs |
| iShares Long-Term Corporate Bond ETF |
5.97 |
13.35 |
8.56 |
8.33 |
| iShares Preferred and Income Securities ETF |
-6.07 |
-1.23 |
1.31 |
3.12 |
| iShares U.S. Treasury Bond ETF |
8.66 |
10.33 |
5.44 |
3.96 |
| iShares J.P. Morgan USD EM Bond ETF |
-2.79 |
0.56 |
3.21 |
4.83 |
| iShares J.P. Morgan EM Corporate Bond ETF |
-0.29 |
3.71 |
4.11 |
4.89 |
| iShares iBoxx High Yield Corporate Bond ETF |
-5.36 |
-1.62 |
2.54 |
3.62 |
| iShares National Muni Bond ETF |
2.10 |
4.27 |
3.91 |
3.61 |
| Sector Equity ETFs |
| iShares U.S. Technology ETF |
16.41 |
37.45 |
25.58 |
22.06 |
| iShares U.S. Industrials ETF |
-9.43 |
-3.47 |
6.08 |
8.98 |
| iShares Global Consumer Staples ETF |
-5.98 |
0.45 |
2.84 |
5.24 |
| iShares U.S. Financials ETF |
-19.14 |
-10.48 |
2.71 |
6.11 |
| iShares Global Comm Services ETF |
0.60 |
8.90 |
4.71 |
3.09 |
| iShares Global REIT ETF |
-22.73 |
-17.36 |
-1.63 |
1.77 |
| iShares U.S. Utilities ETF |
-12.19 |
-4.35 |
5.44 |
9.56 |
| iShares U.S. Healthcare ETF |
0.60 |
11.91 |
10.68 |
7.99 |
| iShares Global Consumer Discretionary ETF |
-5.63 |
0.92 |
7.77 |
6.93 |
| iShares U.S. Energy ETF |
-35.93 |
-37.23 |
-13.56 |
-10.68 |
Source: iShares
Performance numbers are total returns. Total return represents changes to the NAV and accounts for distributions from the fund. The performance quoted represents past performance and does not guarantee future results. Investment return and principal value of an investment will fluctuate.
Data through 6/30/2020
The Fed and the recession push rates into the basement
As the year began, the Fed had projected no change in the fed funds rate. Assuming economic activity might modestly accelerate, such a forecast would be considered reasonable. The Fed cut the fed funds rate three times in 2019 in response to slower economic growth and the uncertainty emitted by the U.S.-China trade war.
But the coronavirus crisis dramatically changed the calculus. The Fed quickly cut rates to zero, began massive bond buys, and explicitly said it has no intention of raising rates anytime soon.
Not surprisingly, Treasury yields fell across the curve, with the longer end of the curve dropping to record lows.
As we move into the second half of the year, inflation remains well below target, the Fed plans to hold the fed funds rate at near zero for the foreseeable future, and uncertainty remains extraordinarily high.
All are playing a role in keeping short- and long-term yields at rock bottom levels.
| Table 8: Treasury Rates (End of Month) |
| Month |
3-Month
T-Bill |
2-Year Treasury Yield |
10-Year Treasury Yield |
30-Year Treasury Yield |
10-year minus
2-year (Yield curve) |
10-year minus
3-month (Yield curve) |
| Jan 2020 |
1.52 |
1.33 |
1.51 |
1.99 |
0.18 |
-0.01 |
| Feb |
1.25 |
0.86 |
1.13 |
1.65 |
0.27 |
-0.12 |
| Mar |
0.11 |
0.23 |
0.70 |
1.35 |
0.47 |
0.59 |
| Apr |
0.09 |
0.20 |
0.64 |
1.28 |
0.44 |
0.55 |
| May |
0.14 |
0.16 |
0.65 |
1.41 |
0.49 |
0.51 |
| Jun |
0.16 |
0.16 |
0.66 |
1.41 |
0.50 |
0.50 |
Source: St. Louis Federal Reserve
Corporates
As the Covid-19 crisis slammed into credit markets, few sectors were spared, as we saw yield spike even in the safest corporate bonds.
Unlike Treasuries, which are not subject to credit risk, corporate bonds are. We saw this play out across the “credit quality curve,” especially in junk bonds (BB+ rated and lower).
As lender of last resort, the Fed announced it would support the corporate bond market by direct purchases of bonds and ETFs, and it would buy high-yield debt (so-called fallen angels that had been rated investment grade pre-crisis), including high-yield ETFs.
The goal—maintain liquidity and functioning credit markets. Some argue the Fed is encouraging moral hazard, as it protects speculators from bad decisions. Conversely, do nothing and the economic damage could be far worse today.
In my view, the Fed reacted to the crisis at hand and will monitor possible consequences on another day.
| Table 9: BofA Merrill Lynch U.S. Corporate Effective Yield (End of Month) |
| Month |
AAA |
AA |
A |
BBB |
BB |
B |
CCC or below |
High-yield spread* |
| Jan 2020 |
2.28 |
2.15 |
2.37 |
2.93 |
3.82 |
5.45 |
11.86 |
4.03 |
| Feb |
2.07 |
1.93 |
2.17 |
2.80 |
4.37 |
6.32 |
12.81 |
5.06 |
| Mar |
2.08 |
2.42 |
2.96 |
4.59 |
6.89 |
9.99 |
18.21 |
8.77 |
| Apr |
1.84 |
1.89 |
2.26 |
3.42 |
5.83 |
8.38 |
18.09 |
7.63 |
| May |
1.55 |
1.65 |
2.02 |
3.04 |
5.10 |
6.95 |
15.41 |
6.54 |
| Jun |
1.63 |
1.57 |
1.81 |
2.68 |
5.11 |
7.01 |
14.46 |
6.44 |
Source: St. Louis Federal Reserve.
(BBB) is the lowest grade of investment debt.
*ICE BofAML US High-Yield Master II Option-Adjusted Spread—a proxy for the difference between the yield on high-yield bonds and long-term Treasuries.
Commodities take a beating but rise from lows
Falling economic demand equates to falling demand for commodities. We saw it in price action earlier in the year. Incredibly, the price of oil briefly fell well below zero, as sellers of futures contracts were forced to pay buyers to take the contract.
With falling production at home and reduced production by OPEC+, prices have rallied from the depths but remain well below last December’s peak.
The dollar, which rallied during a flight-to-quality move earlier in the year, has eased off recent highs.
Meanwhile, economic uncertainty and the Fed’s generosity have fueled gold’s rise.
| Table 10: Key Commodities/Indexes |
| |
Jun 30, 2020 |
Dec 31, 2019 |
| WTI crude spot price |
$39.27 |
$61.06 |
| Gold—London Fixing |
$1,800.50 |
$1,523.10 |
| Dollar Index Trade Weighted—Broad |
120.8643 |
114.7189 |
| Thomson Reuters/CoreCommodity CRB Index |
146.5239 |
196.6359 |
Source: St. Louis Federal Reserve, CoreCommodity Indexes
GDP takes biggest hit since 2008 recession
Q1 GDP fell at an annualized pace of 5% in the first quarter, the largest contraction since Q4 2008 when GDP declined by 8.4%.
Although consumer spending has accelerated in Q2, uncertainties in global growth and trade have weighed on business sentiment.
Expect Q2’s decline to be much worse than Q1, according to economists and the latest estimate from the Atlanta Fed’s GDPNow model, which suggests that the largest measure of the value of goods and services in the economy could contract by a record 35.5% (as of July 9).
Figure 1: U.S. Economic Output
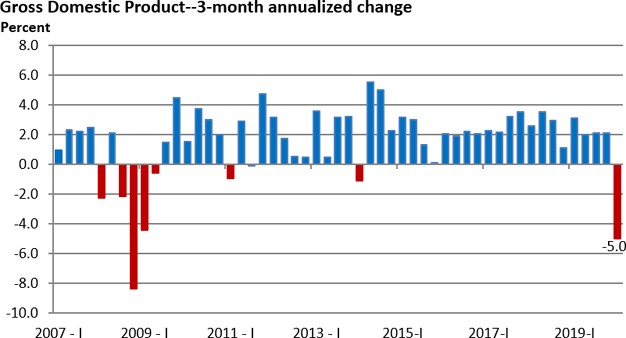
Source: Bureau of Economic Analysis Last Date Q1 2020
GDP will undergo annual revisions when Q2 is released in late July
Covid and lockdowns fuel record job losses
The economy was expanding and creating jobs at the beginning of the year, with a monthly average of 232,500 jobs added in January and February. Meanwhile, the unemployment rate fell to 3.5% in February, the lowest reading since 1969 (the jobless rate also hit 3.5% in September, November and December 2019).
Lockdowns designed to prevent and slow the spread of Covid fueled a record increase of 20.8 million job losses in April. The unemployment rate hit 14.7%, the highest since monthly records began in 1948.
Conversely, the reopening of businesses and paycheck protection loans helped fuel a record bounce in nonfarm payrolls in May and June.
Thus far, one-third of all jobs lost in the first two months of the Covid crisis have been reclaimed. It’s much better than almost anyone could have hoped for at the depth of the economic crisis.
Yet, some jobs may never come back. Much will depend on the path of the virus, the speed at which a vaccine or effective treatment may be developed, and how quickly consumers venture back into public spaces and resume prior spending patterns.
| Table 11: Key Labor Market Indicators |
| |
Nonfarm payrolls |
Unemployment rate % |
| Jan 2020 |
214,000 |
3.6 |
| Feb |
251,000 |
3.5 |
| Mar |
-1,373,000 |
4.4 |
| Apr |
-20,787000 |
14.7 |
| May (prelim) |
2,699,000 |
13.3 |
| Jun (prelim) |
4,800,000 |
11.1 |
Source: U.S. BLS
A more real-time measure of the labor market is provided by weekly jobless claims data. First-time claims hit a record 6.8 million in the week ended March 28. While first-time claims have fallen, they remain at a historically high level.
First round of claims: lockdowns
Second round of claims: falling demand in the economy forces continued layoffs
Some 50.3 million first-time claims have been filed since March 14 through July 4. Continuing claims of 18.1 million as of June 27 signal that laid off and furloughed workers are finding new jobs or are being recalled.
Still, let’s be careful not to minimize the economic hardships that have been imposed by the Covid-19 recession. They are unparalleled in modern times.
| Table 11a: Key Labor Market Indicators |
| |
First-time jobless claims |
Continuing claims |
| 1/4/2020 |
212,000 |
1,759,000 |
| 1/11/2020 |
207,000 |
1,735,000 |
| 1/18/2020 |
220,000 |
1,704,000 |
| 1/25/2020 |
212,000 |
1,753,000 |
| 2/1/2020 |
201,000 |
1,678,000 |
| 2/8/2020 |
204,000 |
1,729,000 |
| 2/15/2020 |
215,000 |
1,693,000 |
| 2/22/2020 |
220,000 |
1,720,000 |
| 2/29/2020 |
217,000 |
1,699,000 |
| 3/7/2020 |
211,000 |
1,702,000 |
| 3/14/2020 |
282,000 |
1,784,000 |
| 3/21/2020 |
3,307,000 |
3,059,000 |
| 3/28/2020 |
6,867,000 |
7,446,000 |
| 4/4/2020 |
6,615,000 |
11,914,000 |
| 4/11/2020 |
5,237,000 |
15,819,000 |
| 4/18/2020 |
4,442,000 |
18,011,000 |
| 4/25/2020 |
3,867,000 |
22,377,000 |
| 5/2/2020 |
3,176,000 |
22,548,000 |
| 5/9/2020 |
2,687,000 |
24,912,000 |
| 5/16/2020 |
2,446,000 |
20,841,000 |
| 5/23/2020 |
2,123,000 |
21,268,000 |
| 5/30/2020 |
1,897,000 |
20,606,000 |
| 6/6/2020 |
1,566,000 |
20,289,000 |
| 6/13/2020 |
1,540,000 |
19,231,000 |
| 6/20/2020 |
1,482,000 |
18,760,000 |
| 6/27/2020 |
1,413,000 |
18,062,000 |
| 7/4/2020 |
1,314,000 |
— |
Source: St. Louis Federal Reserve
Continuing claims are onew eek behind first-time claims
Consumer confidence falters, rebounds
Pre-Covid, consumer confidence had reached levels that had only been surpassed during the tech boom of the late 1990s.
While consumer sentiment fell at a record pace, April’s low of 85.7 would be the highest bottom of any recession dating back to the late 1970s.
Fiscal stimulus, generous jobless benefits, and a general belief that jobs losses might be short-lived likely kept sentiment from approaching the record low of 25.3 in the Great Recession.
Consumer spending and consumer confidence do not move in lockstep on a month-by-month basis. However, June’s better-than-expected advance creates a tailwind for spending, at least over the short term.
| Table 12: Consumer Confidence Index |
| Jan 2020 |
130.4 |
| Feb |
132.6 |
| Mar |
118.8 |
| Apr |
85.7 |
| May |
85.9 |
| Jun |
98.1 |
Source: Conference Board, Investors.com
Money supply growth soars
The growth in the money supply has soared to unprecedented levels thanks to monetary and fiscal stimulus. A soaring money supply growth argues strongly for a V-shaped recovery. However, the transmission mechanism between consumers and businesses has been broken via the virus and the fear of going into public places.
For perspective, the prior record of 27.5% was set in March 1983.
| Table 13: M2 Money Supply |
| |
13-week annualized growth |
| 1/6/2020 |
6.1% |
| 1/13/2020 |
7.1 |
| 1/20/2020 |
7.8 |
| 1/27/2020 |
7.8 |
| 2/3/2020 |
7.0 |
| 2/10/2020 |
7.2 |
| 2/17/2020 |
7.0 |
| 2/24/2020 |
6.2 |
| 3/2/2020 |
8.7 |
| 3/9/2020 |
11.1 |
| 3/16/2020 |
14.4 |
| 3/23/2020 |
27.2 |
| 3/30/2020 |
39.7 |
| 4/6/2020 |
42.3 |
| 4/13/2020 |
44.8 |
| 4/20/2020 |
55.2 |
| 4/27/2020 |
66.1 |
| 5/4/2020 |
74.0 |
| 5/11/2020 |
82.2 |
| 5/18/2020 |
85.0 |
| 5/25/2020 |
86.2 |
| 6/1/2020 |
83.4 |
| 6/8/2020 |
84.2 |
| 6/15/2020 |
79.5 |
| 6/22/2020 |
64.6 |
| 6/29/2020 |
49.4 |
Source: St. Louis Federal Reserve
M2 = M1 (cash + checking accounts) + savings accounts + CDs + Money Mkt Funds + Mutual Funds
A disinflationary environment
There are two key pricing gauges of retail inflation that investors closely follow—the Consumer Price Index (CPI) and the Personal Consumption Expenditures Price Index (PCE Price Index). The Fed favors the PCE Price Index.
For much of the economic expansion, the rate of inflation has briefly risen above the Fed’s goal of 2%, but it has failed to maintain that level. The steep drop in oil price has weighed on headline inflation this year. The core rate, which excludes food and energy, has also come down.
Absent supply chain issues, most companies have little pricing power today.
Figure 2: The Fed-Favored Inflation Measure
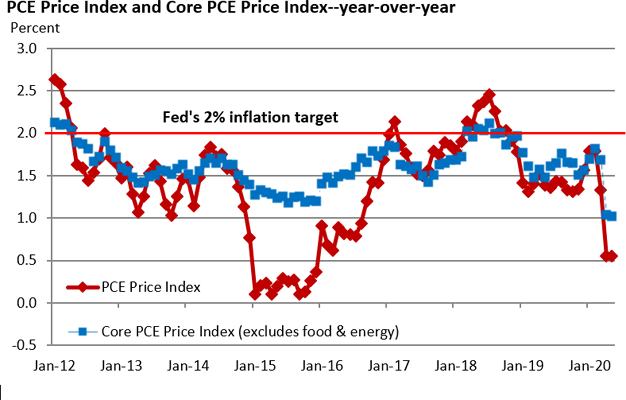
Source: St. Louis Federal Reserve. Last date: May 2020
High frequency data
Most economic reports are a look in the rearview mirror—what happened four to eight weeks ago. In today’s environment, investors and analysts are following less conventional data points, but ones that offer a weekly or even daily look at what may be happening in the economy.
Given the daily detail, the data and trends can be more easily viewed with graphic illustrations.
Apple offers the number requests for directions through Apple Maps. While requests have recovered (with the notable exception of mass transit), the recent uncertainty tied to the spike in cases has modestly pressured requests for driving and walking.
Figure 3: Travel Directions
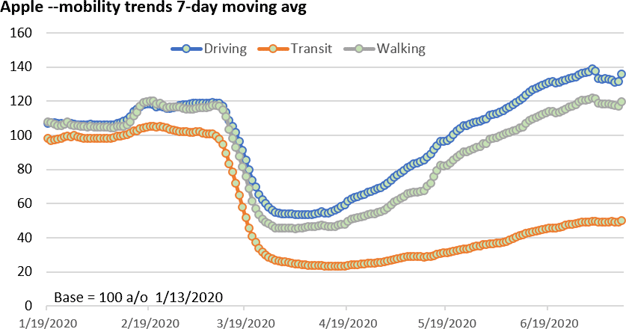
Source: Apple data reflects request for directions in Apple Maps 7/11/2020
Travel through TSA checkpoints is down sharply versus a year ago but has rebounded from April lows. The data may be distorted around the July 4 holiday, and the resurgence in Covid could slow booking. Nonetheless, the seven-day moving average remains in an upward trend.
Figure 4: Air Travel
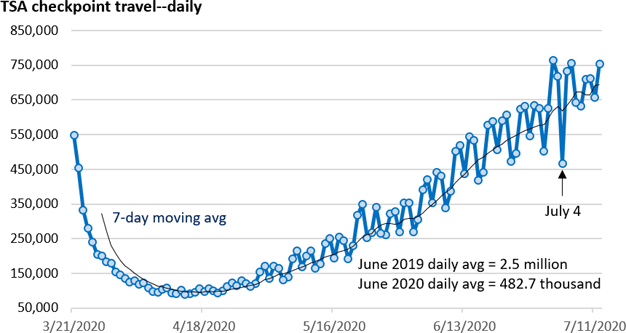
Source: TSA 7/12/2020
Restaurant bookings via OpenTable have rebounded as restaurants reopened. However, bookings have plateaued since mid-June.
Social distancing requirements imposed by state and local governments will create hurdles for the foreseeable future.
Figure 5: Eating Out
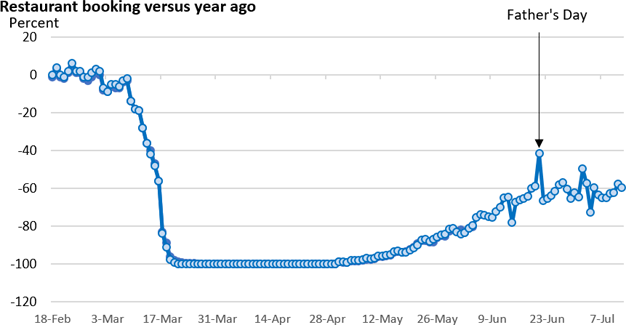
Source: OpenTable 7/9/2020
Daily demand for gasoline is released weekly. The data can sometimes be noisy. As Figure 6 illustrates, we’re driving again.
Figure 6: Gasoline Usage
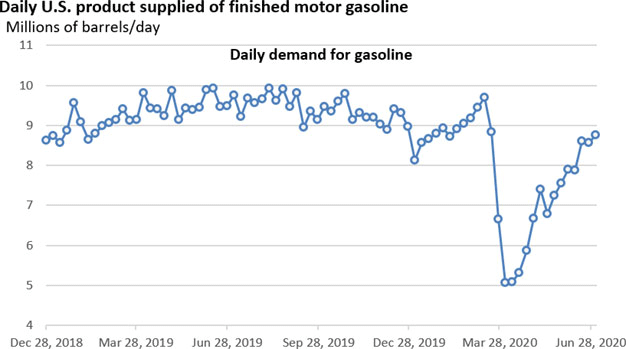
Source: Energy Information Administration: Week ended 7/3/2020