Our “2017 Year in Numbers” article, published this past January, noted the following:
We are now entering 2018 with the brightest outlook in years: moderate economic growth, a synchronized global economic recovery, low interest rates, and forecasts we’ll see double-digit profit growth throughout 2018 (Thomson Reuters).
The contrarian would argue that it’s time to unwind bullish positions against such a positive backdrop. When good news pours in, can it really get any better?
The bulls would never discount the possibility that unexpected events might force a 10% correction, but they would also argue that bear markets correlate closely with recessions. Odds of a recession this year are currently low.
As January unfolded, the bullish train that carried investors down the tracks last year rolled into 2018. The just-passed corporate tax cut forced analysts to sharply ratchet 2018 profit forecasts higher, and bullish sentiment was quick to price in the rosier outlook.
That brings us to the question asked above, “When good news pours in, can it really get any better?”
The yield on the 10-year bond began to tick higher in January, and clouds began to gather on what had been a cloudless day. Short-term traders began to exit stocks and volatility returned. What may have been a modest downtick in shares quickly turned into a 10% correction when products tied to volatility began to unwind.
Odds of a 2018 recession remain low, Q2 growth has accelerated after a weak Q1 start, and corporate profits are forecast to top 20% this year—extremely impressive. But the S&P 500 Index and the Dow have floundered.
In part, the strong economic and profit backdrop was priced in. But throw in a new wrinkle that’s generated uncertainty—rising trade tensions have prevented the Dow and S&P 500 Index from reclaiming their January highs, in my view. Moreover, the recent strength in the dollar is also creating a degree of resistance for the large multinationals.
Meanwhile, the tech-heavy NASDAQ has performed admirably and hit new highs, and small caps, which have less international exposure, have also racked up a strong first-half gain. Mid caps, which have eked out a more modest advance, also topped prior highs.
Despite the onslaught of unsettling headlines, the Dow and S&P 500 are not far from January’s peak.
The economy continues to expand, investors have priced in the uptick on the 10-year Treasury (which have recently settled back below 3%), and the Fed has yet to deviate from its path of gradual rate hikes.
| Table 1: Stock Index Performance |
| |
YTD*% |
3-year annualized change % |
| Dow Jones Industrial Avg |
-1.8 |
11.3 |
| Transportation Average |
-2.5 |
8.6 |
| Utility Average |
-1.6 |
8.8 |
| 65 Composite |
-2.0 |
10.2 |
| Total Stock Market |
2.3 |
9.5 |
| Broad Stock Market |
2.3 |
9.5 |
| Large-Cap Growth TSM |
7.2 |
12.3 |
| Large-Cap Value TSM |
-2.8 |
7.1 |
| Mid-Cap Growth TSM |
5.0 |
9.1 |
| Mid-Cap Value TSM |
-0.6 |
7.8 |
| Small-Cap Growth TSM |
7.6 |
9.5 |
| Small-Cap Value TSM |
0.9 |
6.9 |
| Micro-Cap TSM |
10.2 |
9.5 |
| Select REIT |
-0.2 |
3.8 |
| Internet |
25.5 |
27.9 |
| Nasdaq Stock Market |
| Composite |
8.8 |
14.8 |
| Nasdaq 100 |
10.1 |
17.1 |
| Q-50 |
3.2 |
11.4 |
| Biotech |
2.9 |
-3.0 |
| Computer |
9.7 |
21.5 |
| Industrials |
10.8 |
14.8 |
| Insurance |
-6.6 |
5.6 |
| Banks |
3.6 |
12.9 |
| Telecommunications |
4.4 |
10.0 |
| Standard & Poor’s |
| 500 Index |
1.7 |
9.7 |
| 100 Index |
1.0 |
9.6 |
| MidCap 400 |
2.7 |
9.2 |
| SmallCap 600 |
8.7 |
12.4 |
| SuperComp 1500 |
2.0 |
9.8 |
| Other U.S. Indexes |
| Russell 1000 |
1.9 |
9.5 |
| Russell 2000 |
7.0 |
9.6 |
| Russell 3000 |
2.3 |
9.5 |
| PHLX Gold/Silver |
-4.3 |
8.5 |
| PHLX Housing |
-12.3 |
9.7 |
| PHLX Oil Service |
3.6 |
-8.0 |
| PHLX Semiconductor |
4.8 |
24.7 |
Sources: SIX Financial Information, WSJ Market Data Group
*Through 6.29.18
Record earnings
Barring an unforeseen shock, companies will have a banner year, but 2018’s outsized growth rate can be traced to the cut in the corporate tax rate. In other words, it’s unsustainable and investors looked past Q1’s impressive numbers.
| Table 2: Earnings Highlights |
| Date |
Change in S&P 500 earnings vs. one year ago |
| Q1 2016 |
-5.0 |
| Q2 2016 |
-2.1 |
| Q3 2016 |
4.3 |
| Q4 2016 |
8.0 |
| Q1 2017 |
15.3 |
| Q2 2017 |
12.3 |
| Q3 2017 |
8.5 |
| Q4 2017 |
14.8 |
| Q1 2018 |
26.6 |
Source: Thomson Reuters I/B/E/S
Corporate buybacks hit record
S&P Dow Jones Indexes announced preliminary results showing S&P 500 Q1 2018 stock buybacks rose 38% from the prior quarter to a record $189.1 billion, eclipsing the prior record from Q3 2007 (coincidently or not, as the market was about to top) by 9.9%. In addition, the 12-month returns of buybacks and cash dividends topped $1 trillion for the first time.
| Table 3: S&P 500 Return of Capital |
| |
Stock buybacks |
Cash dividends |
| 3/29/18 (prelim) |
$189.1 billion |
$109.2 billion |
| 12/29/17 |
137.0 |
109.5 |
| 9/29/17 |
129.2 |
105.5 |
| 6/30/17 |
120.1 |
104.1 |
| 3/31/17 |
$133.2 |
$100.9 |
| 12/31/2016 |
135.3 |
103.8 |
| 9/30/2016 |
112.2 |
98.4 |
| 6/30/2016 |
127.5 |
98.3 |
| 3/31/2016 |
161.4 |
96.7 |
| 12/31/2015 |
145.9 |
99.4 |
| 9/30/2015 |
150.6 |
95.1 |
| 6/30/2015 |
131.6 |
94.5 |
Source: S&P Dow Jones Indexes
Tax reform and the lower tax rate on repatriation of overseas earnings played a big role in unlocking a significant source of cash.
But is it having the intended effect—lifting share prices? Buybacks create demand for shares and increase EPS, but a July 8 article in the Wall Street Journal pointed out that “57% of the more than 350 companies in the S&P 500 that bought back shares so far this year are trailing” the large-cap index.
That doesn’t appear to be slowing share repurchases. S&P Senior Index Analyst Howard Silverblatt said in a tweet: “2018 is expected to continue strong for buybacks & dividends, setting records.”
Key S&P 500 sectors
In what’s best described as a lackluster performance by the S&P 500, only three sectors managed to top the S&P 500 Index during the first six months of the year. Notably, the top two, consumer discretionary and technology, have been the top performers since the bull market began in early 2009.
Despite rising interest rates, real estate and utilities, which offer more attractive dividends, managed to hold up reasonably well. However, consumer staples and telecom, which are also purchased for yield but are grappling with industry-specific issues, lagged far behind.
The flattening yield curve played a role in dampening returns among financials, while industrials struggled amid rising trade tensions around the globe.
| Table 4: Standard & Poor’s U.S. Sectors Performance |
| Category |
YTD*% |
| Consumer discretionary |
10.8 |
| Info tech |
10.2 |
| Energy |
5.3 |
| S&P 500 Index |
1.7 |
| Health care |
1.0 |
| Real estate |
-1.0 |
| Utilities |
-1.5 |
| Materials |
-4.0 |
| Financials |
-4.9 |
| Industrials |
-5.6 |
| Consumer staples |
-9.9 |
| Telecom |
-10.8 |
Source: StockCharts
*Through 6.29.18
Around the world
Last year’s theme was the synchronized global recovery, with Europe having a standout year.
Growth across the Atlantic slowed in Q1. European Central Bank President Mario Draghi acknowledged the more moderate pace, but remains cautiously optimistic.
Growth in Europe is unlikely to stall, but the exchange of tariffs between the U.S. and Europe could take a toll on the economies in Europe that are more dependent on exports, including Europe’s largest economy, Germany. We’re seeing the uncertainty reflected in first-half market performance.
The war of words between the U.S. and China has also pressured markets in China. (For additional insight, please see “Trade War: 5 Things Clients Need to Know.”)
| Table 5: Global Indexes |
| |
YTD* % |
3-year annualized change % |
| The Global Dow (World) |
-3.5 |
5.7 |
| The Global Dow Euro (World) |
-0.8 |
4.1 |
| DJ Global Index (World) |
-1.5 |
6.2 |
| DJ Global ex U.S. (World) |
-4.9 |
2.9 |
| Asia Pacific |
| All Ordinaries (Australia) |
2.0 |
5.1 |
| S&P/ASX 200 (Australia) |
2.1 |
4.5 |
| Dow Jones China 88 (China) |
-13.6 |
-2.3 |
| Shanghai Composite (China) |
-13.9 |
-11.1 |
| Hang Seng (Hong Kong) |
-3.2 |
3.7 |
| S&P BSE Sensex (India) |
4.0 |
8.6 |
| Jakarta Composite (Indonesia) |
-8.8 |
5.9 |
| Nikkei 300 (Japan) |
-4.6 |
1.1 |
| Nikkei Stock Avg (Japan) |
-2.0 |
3.5 |
| Topix Index (Japan) |
-4.8 |
2.1 |
| FTSE Bursa Malaysia KLCI (Malaysia) |
-5.9 |
unch. |
| S&P/NZX 50 (New Zealand) |
6.5 |
16.2 |
| PSEi (Philippines) |
-15.9 |
-1.7 |
| Straits Times (Singapore) |
-3.9 |
-0.1 |
| Kospi (South Korea) |
-5.7 |
4.1 |
| Colombo Stock Exchange (Sri Lanka) |
-2.7 |
-4.1 |
| Weighted (Taiwan) |
1.8 |
5.5 |
| SET (Thailand) |
-9.0 |
1.8 |
| Europe |
| Stoxx Europe 600 (Europe) |
-2.4 |
-0.5 |
| Stoxx Europe 50 (Europe) |
-4.2 |
-3.0 |
| Euro STOXX 50 (Euro zone) |
-3.1 |
-0.7 |
| Euro STOXX (Euro zone) |
-2.2 |
1.6 |
| ATX (Austria) |
-4.8 |
10.3 |
| Bel-20 (Belgium) |
-6.5 |
0.9 |
| PX 50 (Czech Republic) |
-1.3 |
3.0 |
| OMX Copenhagen (Denmark) |
-4.5 |
1.5 |
| OMX Helsinki (Finland) |
5.5 |
6.0 |
| CAC 40 (France) |
0.2 |
3.0 |
| DAX (Germany) |
-4.7 |
3.6 |
| BUX (Hungary) |
-8.3 |
18.7 |
| FTSE MIB (Italy) |
-1.0 |
-1.4 |
| AEX (Netherlands) |
1.3 |
5.0 |
| All-Shares (Norway) |
10.8 |
14 |
| WIG (Poland) |
-12.2 |
1.9 |
| PSI 20 (Portugal) |
2.6 |
unch. |
| RTS Index (Russia) |
-0.02 |
7.5 |
| IBEX 35 (Spain) |
-4.2 |
-3.9 |
| SX All Share (Sweden) |
0.9 |
4.0 |
| Swiss Market (Switzerland) |
-8.2 |
-1.0 |
| BIST 100 (Turkey) |
-16.3 |
5.7 |
| FTSE 100 (U.K.) |
-0.7 |
4.9 |
| FTSE 250 (U.K.) |
0.5 |
5.9 |
| Americas |
| DJ Americas (Americas) |
1.2 |
8.8 |
| Merval (Argentina) |
-13.4 |
32.1 |
| Sao Paulo Bovespa (Brazil) |
-4.8 |
11.1 |
| S&P/TSX Comp (Canada) |
0.4 |
4.0 |
| Santiago IPSA (Chile) |
-6.8 |
8.0 |
| IPC All-Share (Mexico) |
-3.4 |
2.2 |
| Other countries |
| Tel Aviv (Israel) |
0.5 |
-2.6 |
| FTSE/JSE All-Share (South Africa) |
-3.2 |
3.5 |
Sources: SIX Financial Information; WSJ Market Data Group Europe, Australia, Far East; U.S.-dollar terms; *Through 6.29.2018
Key MSCI indexes highlight the uncertain mood since the beginning of the year, while the rise in the dollar has exacerbated the downside of the indexes when priced in dollars.
Emerging markets, which performed strongly last year, are seeing a reversal in fortunes. Recent strength in the dollar, the uptick in U.S. rates and trade anxieties have all conspired to create headwinds for emerging market stocks.
| Table 6: Other Global Indexes |
| |
YTD% |
YTD (%) in local currencies |
| MSCI EAFE |
-4.5 |
-2.7 |
| MSCI World |
-0.7 |
0.2 |
| MSCI World Ex-U.S.A. |
-4.5 |
-2.4 |
| MSCI EM |
-7.7 |
-3.9 |
Source: MSCI.com. Through 6.29.2018
Style—small caps on top as growth leads the way
Small-cap funds led the way—no surprise given the strength in the indexes that measure smaller companies.
In the aggregate, smaller companies have less direct exposure to what’s happening internationally. In addition, the uptick in the dollar is less likely to ding revenues.
In each category, growth continues to dominate. And the dominance extends to five-year performance.
Investors simply aren’t clamoring for value stocks. Instead, many are willing to pay a premium for the Amazons, the Facebooks, and the Netflix of the stock market. The big names are growing quickly, and the expanding economy is providing an added boost.
Meanwhile, most bond funds struggled in the first half of the year. Bonds reduce volatility in a diversified portfolio, but rising interest rates created a headwind for fixed income.
| Table 7: Style Performance |
| Investment objective |
YTD% |
1-year annualized change % |
3-year annualized change % |
5-year annualized change % |
| Large-Cap Core Funds |
1.65 |
12.72 |
10.03 |
11.85 |
| Large-Cap Growth Funds |
8.96 |
22.38 |
13.26 |
15.24 |
| Large-Cap Value Funds |
-1.30 |
8.33 |
7.96 |
9.88 |
| Mid-Cap Core Funds |
1.58 |
10.44 |
7.84 |
10.38 |
| Mid-Cap Growth Funds |
7.52 |
19.20 |
10.04 |
12.71 |
| Mid-Cap Value Funds |
-0.06 |
7.95 |
7.30 |
9.94 |
| Small-Cap Core Funds |
4.78 |
13.99 |
9.37 |
11.00 |
| Small-Cap Growth Funds |
12.18 |
24.57 |
10.95 |
12.90 |
| Small-Cap Value Funds |
3.74 |
12.48 |
8.96 |
9.71 |
| Multi-Cap Core Funds |
1.82 |
12.16 |
8.89 |
11.18 |
| Multi-Cap Growth Funds |
7.91 |
20.6 |
11.46 |
13.91 |
| Multi-Cap Value Funds |
-1.06 |
8.41 |
7.65 |
9.67 |
| Equity Income Funds |
-0.54 |
8.76 |
8.38 |
9.40 |
| S&P 500 Funds |
2.41 |
13.89 |
11.39 |
12.84 |
| Sector/Specialty Funds |
| Specialty Diversified Equity |
8.39 |
4.84 |
0.17 |
-3.41 |
| Balanced Funds |
-0.10 |
6.40 |
5.51 |
6.80 |
| Stock/Bond Blend Funds |
-0.23 |
6.17 |
5.07 |
6.16 |
| All USDE Funds |
3.36 |
13.44 |
8.74 |
10.72 |
| Science & Technology Funds |
8.49 |
23.49 |
16.22 |
16.89 |
| Telecommunication Funds |
-2.59 |
2.28 |
4.71 |
7.07 |
| Health/Biotechnology Funds |
8.25 |
14.7 |
4.07 |
15.5 |
| Utility Funds |
1.36 |
5.29 |
8.44 |
8.39 |
| Natural Resources Funds |
3.41 |
17.75 |
-0.99 |
-1.55 |
| Sector Funds |
0.48 |
4.77 |
6.2 |
6.78 |
| Real Estate Funds |
0.22 |
3.18 |
6.92 |
7.49 |
| Financial Services Funds |
0.18 |
10.08 |
10.19 |
11.41 |
| Gold-Oriented Funds |
-7.06 |
-4.78 |
7.30 |
0.09 |
| Global Funds |
| Global Funds |
0.37 |
10.31 |
7.83 |
9.12 |
| International Stock Funds |
-2.72 |
7.14 |
4.88 |
6.24 |
| European Region Funds |
-2.34 |
5.58 |
4.78 |
6.71 |
| Emerging Markets Funds |
-7.05 |
6.1 |
4.68 |
4.12 |
| Latin American Funds |
-12.98 |
0.43 |
2.89 |
-2.95 |
| Pacific Region Funds |
-3.34 |
11.88 |
6.48 |
8.82 |
| Bond Funds |
| Short-Term Bond Funds |
0.07 |
0.59 |
1.09 |
1.14 |
| Long-Term Bond Funds |
-2.80 |
-0.75 |
2.62 |
3.19 |
| Intermediate Bond Funds |
-1.67 |
-0.52 |
1.60 |
2.14 |
| Intermediate U.S. Funds |
-0.24 |
1.33 |
1.36 |
1.08 |
| Short-Term U.S. Funds |
-1.67 |
-0.52 |
1.60 |
2.14 |
| Long-Term U.S. Funds |
-1.68 |
-1.07 |
0.97 |
1.67 |
| General U.S. Taxable Funds |
-1.36 |
0.44 |
2.59 |
3.19 |
| High-Yield Taxable Funds |
-0.32 |
2.01 |
4.10 |
4.32 |
| Mortgage Funds |
-0.76 |
0.03 |
1.13 |
1.85 |
| World Bond Funds |
-2.94 |
-0.42 |
2.4 |
1.47 |
| All Taxable Bond Funds |
-0.86 |
0.64 |
2.12 |
2.24 |
| Short-Term Muni Funds |
-0.03 |
0.08 |
0.33 |
0.49 |
| Intermediate Muni Funds |
-0.30 |
0.84 |
1.94 |
2.49 |
| General & Insured Muni Funds |
-0.14 |
1.93 |
2.86 |
3.56 |
| High-Yield Municipal Funds |
1.37 |
4.31 |
4.59 |
5.17 |
| Barclays Muni Bond |
-0.25 |
1.56 |
2.85 |
3.53 |
| Barclays Agg Bond |
-1.62 |
-0.4 |
1.72 |
2.27 |
| DJ Corp Bond TR IX |
-3.56 |
-1.26 |
2.96 |
3.53 |
| Miscellaneous |
| DJ Ind Dly Reinv Avg IX |
-0.73 |
16.31 |
14.07 |
12.96 |
| DJ U.S. TSM Growth |
7.74 |
20.97 |
12.94 |
15.67 |
| DJ U.S. Total Stock Market |
3.24 |
14.79 |
11.56 |
13.22 |
| DJ U.S. TSM Value |
-1.23 |
8.77 |
10.18 |
10.82 |
| Dow Jones Global Ex US Tr |
-3.54 |
7.74 |
5.51 |
6.56 |
| MSCI EAFE IX ID |
-4.49 |
4.01 |
2.06 |
3.63 |
| Russell 2000 TR IX |
7.66 |
17.57 |
10.96 |
12.46 |
| Russell 3000 TR IX |
3.22 |
14.78 |
11.58 |
13.29 |
| S&P 500 Daily Reinv IX |
2.65 |
14.37 |
11.93 |
13.42 |
| S&P Sm Cap 600 TR IX |
9.39 |
20.5 |
13.84 |
14.6 |
| S&P Midcap 400 TR IX |
3.49 |
13.5 |
10.89 |
12.69 |
| T-Bill 3 Month TR IX |
0.84 |
1.4 |
0.7 |
0.44 |
| Managed Futures Funds |
-3.91 |
0.03 |
-1.95 |
1.73 |
| Emerging Market Local Currency Debt Funds |
-6.4 |
-2.57 |
1.3 |
-1.47 |
| Global Equity Income Funds |
-2.3 |
4.86 |
5.71 |
6.62 |
| International Equity Income Funds |
-4.79 |
3.18 |
3.09 |
3.99 |
| Mixed-Asset Target Today Funds |
-0.63 |
3.54 |
3.60 |
4.07 |
Sources: Lipper, WSJ Market Data Group. Performance numbers are total return (changes in net asset values with reinvested distributions) for the periods ended June 29, 2018. All performance numbers are final.
As the Fed goes, so goes short-term rates
The Fed can hope to influence longer-term interest rates. It has much more control over short-term rates.
The Fed has been gradually but consistently raising rates on a quarterly basis since the end of 2015. When it decided to forgo a rate hike last September, it announced it would begin to gradually shrink its balance sheet.
Consequently, short-term interest rates have been rising.
The 10-year and 30-year Treasury yields have also been rising, but at a slower pace. Inflation is contained, and accommodative policies at the major global central banks and still-low yields in Europe and Japan have placed a flexible ceiling on U.S. rates.
In addition, analysts have cited increased purchases of long-term Treasuries by pension funds.
Meanwhile, the yield curve continues to flatten, which has caught the eye of investors. While an inverted yield curve has historically preceded a recession, it does not necessarily mean the current expansion is in imminent danger.
Looking back at the last five contractions, a recession ensued on average 21 months after the 10-year/2-year curve inverted, with 10 months being the shortest (1981 recession) and 34 months being the longest (2001 recession).
| Table 8: Treasury Rates (End of Month) |
| Month |
3-Month T-Bill |
2-Year Treasury Yield |
10-Year Treasury Yield |
30-Year Treasury Yield |
10-year minus 2-year (Yield curve) |
10-year minus 3-month (Yield curve) |
| Jan 2018 |
1.44 |
2.14 |
2.72 |
2.95 |
0.58 |
1.28 |
| Feb |
1.63 |
2.25 |
2.87 |
3.13 |
0.62 |
1.24 |
| Mar |
1.70 |
2.27 |
2.74 |
2.97 |
0.47 |
1.04 |
| Apr |
1.84 |
2.49 |
2.95 |
3.11 |
0.46 |
1.11 |
| May |
1.89 |
2.40 |
2.83 |
3.00 |
0.43 |
0.94 |
| Jun |
1.89 |
2.52 |
2.85 |
2.98 |
0.33 |
0.96 |
Source: St. Louis Federal Reserve
Corporates—quality and junk
Corporate bond yields have risen modestly and higher-quality bonds offer a reasonable alternative for investors who require steady income.
Given that the economy is expanding, investor interest in junk bonds remains strong as evidenced by the narrow spreads between quality debt and junk debt.
Junk bonds are sometimes referred to as the canary in the coal mine. When economic conditions deteriorate, companies on the “credit bubble” are more likely to struggle to make interest payments, and investors will be quick to dump these bonds. Result, yields on junk bonds can rise sharply relative to higher quality corporate debt and Treasuries.
Today’s narrower spreads aren’t signaling an imminent recession, underscoring the overall confidence investors have in the economy. Me worry? That’s the message from the high-yield debt market.
But junk bonds are speculative and experience bouts of volatility, and sentiment can temporarily shift or a sector may hit a rough patch.
| Table 9: BofA Merrill Lynch U.S. Corporate Effective Yield (End of Month) |
| Month |
AAA |
AA |
A |
BBB |
BB |
B |
CCC or below |
High-yield spread* |
| Jan 2018 |
3.18 |
3.02 |
3.27 |
3.76 |
4.49 |
5.90 |
10.13 |
3.29 |
| Feb |
3.38 |
3.26 |
3.51 |
4.02 |
4.87 |
6.16 |
10.35 |
3.47 |
| Mar |
3.36 |
3.30 |
3.57 |
4.10 |
5.05 |
6.50 |
10.46 |
3.72 |
| Apr |
3.51 |
3.44 |
3.72 |
4.27 |
5.08 |
6.46 |
10.02 |
3.46 |
| May |
3.41 |
3.39 |
3.68 |
4.27 |
5.22 |
6.55 |
9.85 |
3.63 |
| Jun |
3.51 |
3.51 |
3.80 |
4.41 |
5.35 |
6.60 |
10.04 |
3.71 |
Source: St. Louis Federal Reserve. (BBB) is the lowest grade of investment debt.
*ICE BofAML US High-yield Master II Option-Adjusted Spread—a proxy for the difference between the yield on high-yield bonds and long-term Treasuries.
Oil bubbles up, the dollar rises, gold languishes
Oil, oil and oil. That has been the talk of the town. The price of oil has jumped since the beginning of the year. It’s up nearly 23%. However, oil has a seasonal component to it. Since 2000, WTI crude oil has risen by an average of 13.5% during the first six months of the year.
Today, other factors are contributing to higher prices. OPEC has successfully cut back on production, virtually eliminating the global surplus, while production issues in Venezuela and Libya have taken crude supplies off the market. Additionally, global demand for oil continues to creep higher.
Meanwhile, U.S. crude oil production has surged and is approaching 11 million barrels per day (mbpd), a record (EIA weekly production estimate), up from its recent low of 8.5 mbpd in October 2016.
It has injected needed supply onto the world market. Rising U.S. production clearly has not prevented the rise in prices, but the additional supply has prevented a more forceful reaction.
Elsewhere, the dollar has been stirring. Rising U.S. interest rates are creating a positive backdrop for the greenback. But more robust U.S. economic growth and a moderation in global economic activity are likely tilting the odds in favor of the dollar.
| Table 10: Key Commodities/Indexes |
| |
Jun 29, 2018 |
Dec 29, 2017 |
| WTI crude spot price |
$74.13 |
$60.46 |
| Gold—London Fixing |
$1,250.45 |
$1,296.50 |
| Dollar Index Trade Weighted—Major Currencies |
89.97 |
87.47 |
| Dollar Index Trade Weighted—Broad |
124.12 |
119.07 |
| Thomson Reuters/CoreCommodity CRB Index |
200.39 |
193.86 |
Source: St. Louis Federal Reserve, Bloomberg
GDP shows promise
We saw a brief, modest acceleration in growth last year, but Q1 disappointed.
Q1 has historically been a weak quarter. Economists have yet to pinpoint the reason, but many believe quirks in the models used to seasonally adjust the data may bear some of the blame.
Growth in the second quarter has rebounded and we’ll be treated to an advanced review of Q2 GDP at the end of July.
The $64 million question—will economic growth settle into a higher orbit, or will Q2 turn out to be just the latest bounce in what otherwise has been what I like to call, “a second-gear economic recovery”?
Figure 1: U.S. Economic Output
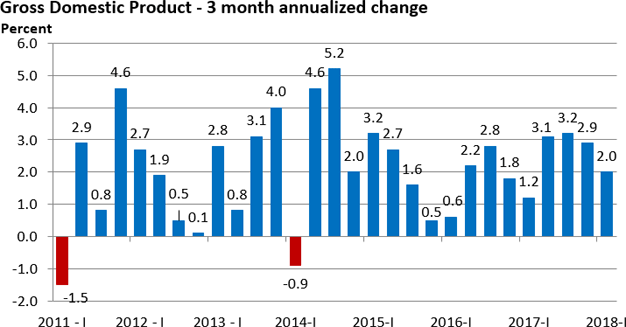
Source: Bureau of Economic Analysis. Last date Q1 2018. GDP will undergo three years of revisions when Q2 data are released in late July.
Payroll growth
Job growth has historically been the byproduct of economic growth, and the first half of 2018 has been no exception.
Nonfarm payrolls growth, as measured by the U.S. BLS Establishment Survey, has averaged a solid 215k during the first six months of 2018 versus 184k during the same period a year ago. It’s encouraging.
The jobless rate briefly dipped to 3.8% in May before rebounding to 4.0% in June. Employment, as measured by the separate Household Survey, grew but a jump in the number of people actively looking for work pushed the key rate higher.
Assuming continued economic growth, how quickly the unemployment rate might fall will depend on two key factors—job growth and labor force growth.
Economic growth will spur hiring and employment growth, even as some businesses find it tougher to find qualified employees. However, rising wages and low unemployment may encourage some folks who have been on the sidelines (not looking for work) to re-enter the labor force and search for jobs.
Faster labor force growth would likely slow the decline in the jobless rate, providing additional workers to fuel economic activity.
| Table 11: Key Labor Market Indicators |
| |
Nonfarm payrolls |
Unemployment rate % |
| Jan 2018 |
176,000 |
4.1 |
| Feb |
324,000 |
4.1 |
| Mar |
155,000 |
4.1 |
| Apr |
175,000 |
3.9 |
| May (prelim) |
244,000 |
3.8 |
| Jun (prelim) |
213,000 |
4.0 |
Source: U.S. BLS
Inflation—back to target
There are two key pricing gauges of retail inflation that investors follow closely—the Consumer Price Index (CPI) and the Personal Consumption Expenditures Price Index (PCE Price Index).
The Fed favors the PCE Price Index.
Thanks to higher oil prices, the headline inflation reading rose to 2.3% y/y in May, its highest reading since early 2012. Core inflation, which minuses out food and energy, is at the Fed’s target of 2%.
An expanding economy is likely to underpin inflation, but don’t expect the Fed to hit the monetary brakes if core inflation inches above 2%. How much tolerance the Fed has for higher inflation is unknown, but the Fed is in no mood to induce a recession in today’s economic environment.
Figure 2: The Fed-Favored Inflation Measure
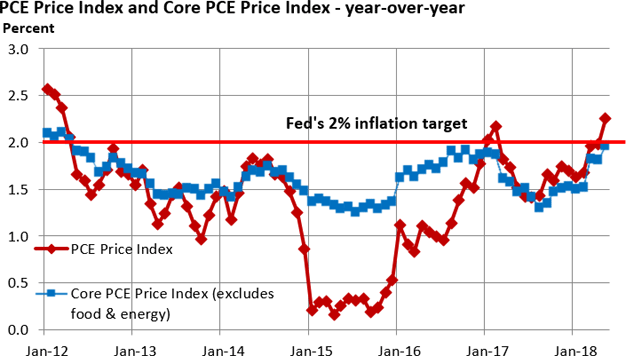
Source: St. Louis Federal Reserve Last date: May 2018