Last year, the major U.S. indexes—the Dow, the S&P 500 Index, and the NASDAQ Composite—turned in their best year since 2013. But the rally in stocks wasn’t confined to this country. Shares around the globe rang up an impressive performance, too.
While low interest rates stoked bullish embers, an acceleration in economic growth around the world was a key factor in last year’s global advance.
At home, the steady and uneventful climb—the lack of volatility in 2017 is definitely noteworthy—can be traced back to the 2016 election. The narrative went something like this: Trump wins, the government is unified, and a host of economic- and investor-friendly policies will come spewing out of Washington, D.C.
Love Trump or love to hate him, investors quickly warmed to the idea that corporate and individual tax cuts, regulatory reform, and a burst of infrastructure and defense spending would fuel economic and profit growth.
When the legislative juggernaut slowed to a crawl, we witnessed what I would call a passing of the baton: from a market that was keen on political action that would stir up growth to simply economic growth itself, both here and abroad.
Add in low inflation and low interest rates and you’ve created a very fertile ground for a bull market.
Congressional gridlock, impeachment talk, a special prosecutor, and North Korea not only failed to trip up the bulls, it failed to inject any meaningful volatility into the market.
As the end of the year approached, Congress moved with uncharacteristic and impressive speed to dramatically slash the corporate tax rate and provide most Americans with modest tax relief.
As investors moved to price in a cut in the corporate tax rate, shares pushed ahead as the year came to a close.
We are now entering 2018 with the brightest outlook in years: moderate economic growth, a synchronized global economic recovery, low interest rates, and forecasts that we will see double-digit profit growth throughout 2018 (Thomson Reuters).
| Table 1: S&P 500 Operating Earnings |
| |
Percent change from one year ago |
| 2016 Q1 |
-5.0 |
| 2016 Q2 |
-2.1 |
| 2016 Q3 |
4.3 |
| 2016 Q4 |
8.0 |
| 2017 Q1 |
15.3 |
| 2017 Q2 |
12.3 |
| 2017 Q3 |
8.5 |
| 2017 Q4 |
11.9* |
Source: Thomson Reuters
*Forecast as of Jan. 2, 2018
The contrarian would argue that it’s time to unwind bullish positions against such a positive backdrop. When good news pours in, can it really get any better?
The bulls would never discount the possibility that unexpected events might force a 10% correction, but they would also argue that bear markets correlate closely with recessions. And odds of a recession this year are currently low.
Charles Schwab’s Chief Investment Strategist Liz Ann Sonders tweeted on December 18: “S&P 500 hit another record high today w/every single industry back above 200-DMAs…prior periods when this occurred, S&P’s returns over following 3, 6 & 12 months were positive with remarkable consistency @bespokeinvest.”
The bulls typically take comfort when the fundamentals line up with the technicals. Stay tuned.
Summary
The NASDAQ led the way in the U.S. amid strength in the technology sector, and the table below highlights that most indexes posted respectable advances. Small and mid caps registered double-digit gains, but lagged behind their larger counterparts.
Small caps have historically outperformed larger companies over the longer term. Given the risk-on trade we saw last year, you might expect strong returns in the small-cap universe that would top large caps. That didn’t happen.
Gradual rate hikes may be dulling some of the enthusiasm for small companies. More likely, it’s the U.S. versus the global economy. You see, smaller firms depend heavily on the domestic economy for growth.
According to FactSet, S&P 500 firms that received more than half their revenues from overseas experienced much faster profit growth than those S&P 500 companies that gather less than half their revenues from overseas.
In other words, international exposure, which is missing from many smaller companies, helped fuel the bottom line in 2017.
| Table 2: Key Stock Indexes Total Return |
|
1-year (%) |
| DJ Industrial Average TR |
28.1 |
| S&P 500 Index TR |
21.8 |
| S&P SmallCap 600 Index TR |
13.2 |
Source: S&P Dow Jones Indexes
| Table 3: Stock Indexes, 2017 Performance |
| Dow Jones |
1-year (%) |
| Industrial Average |
25.1 |
| Transportation Average |
17.3 |
| Utility Average |
9.7 |
| 65 Composite |
20.4 |
| Total Stock Market |
18.9 |
| Broad Stock Market |
18.9 |
| Large-Cap Value TSM |
13.4 |
| Large-Cap Growth TSM |
26.7 |
| Mid-Cap Growth TSM |
22.7 |
| Mid-Cap Value TSM |
11.0 |
| Small-Cap Growth TSM |
18.6 |
| Small-Cap Value TSM |
5.9 |
| Micro-Cap TSM |
14.1 |
| Select REIT |
-0.1 |
| Internet |
38.1 |
| NASDAQ Market |
| Composite |
28.2 |
| Nasdaq 100 |
31.5 |
| Q-50 |
32.6 |
| Biotech |
21.1 |
| Computer |
38.8 |
| Industrials |
24.1 |
| Insurance |
3.2 |
| Banks |
3.5 |
| Telecommunications |
17.4 |
| Standard & Poor’s |
| 500 Index |
19.4 |
| 100 Index |
19.3 |
| MidCap 400 |
14.5 |
| SmallCap 600 |
11.7 |
| SuperComp 1500 |
18.8 |
| Other U.S. Indexes |
| Russell 1000 |
19.3 |
| Russell 2000 |
13.1 |
| Russell 3000 |
18.9 |
| PHLX Gold/Silver |
8.1 |
| PHLX Housing |
44.8 |
| PHLX Oil Service |
-18.6 |
| PHLX Semiconductor |
38.2 |
Source: SIX Financial Information; WSJ Market Data Group
Key S&P 500 sectors
Microsoft, Facebook, Google and Apple all had a banner year. So it’s not a surprise that info technology led the way in 2017. This tech success differs from the dot.com boom of the late 1990s, in that many tech firms today are not only profitable, but are experiencing solid profit growth.
While technology far outpaced the remaining sectors, a number of the economically sensitive groups turned in a strong performance, including materials, consumer discretionary and industrials.
Though energy finished the year in the red, laggards generally included the more defensive industries, such as consumer staples, utilities and telecom.
Investors were in risk-on mode, and the more defensive dividend plays finished well behind the S&P 500.
| Table 4: Standard & Poor’s Key U.S. Sectors, 2017 Performance |
| S&P 500 Sectors |
1-year(%) |
| Info technology |
38.8 |
| Materials |
23.8 |
| Consumer discretionary |
23.0 |
| Financials |
22.2 |
| Health care |
22.1 |
| S&P 500 Index |
21.8 |
| Industrials |
21.0 |
| Consumer staples |
13.5 |
| Utilities |
11.9 |
| Real estate |
10.9 |
| Energy |
-1.0 |
| Telecom |
-1.3 |
Source: S&P Dow Jones Indexes
| Table 5: Global Indexes, 2018 Performance |
| Global Stock Indexes |
1-year (%) |
| The Global Dow (World) |
21.9 |
| The Global Dow Euro (World) |
7.1 |
| DJ Global Index (World) |
21.8 |
| DJ Global ex U.S. (World) |
24.6 |
| Asia Pacific |
| All Ordinaries (Australia) |
7.8 |
| S & P/ASX 200 (Australia) |
7.0 |
| Dow Jones China 88 (China) |
28.9 |
| Shanghai Composite (China) |
6.6 |
| Hang Seng (Hong Kong) |
36.0 |
| S & P BSE Sensex (India) |
27.9 |
| Jakarta Composite (Indonesia) |
20.0 |
| Nikkei 300 (Japan) |
17.6 |
| Nikkei Stock Avg (Japan) |
19.1 |
| Topix Index (Japan) |
19.7 |
| Kuala Lumpur Composite (Malaysia) |
9.4 |
| S & P/NZX 50 (New Zealand) |
22.0 |
| PSEi (Philippines) |
25.1 |
| Straits Times (Singapore) |
18.1 |
| Kospi (South Korea) |
21.8 |
| Colombo Stock Exchange (Sri Lanka) |
2.3 |
| Weighted (Taiwan) |
15.0 |
| SET (Thailand) |
13.7 |
| Europe |
| Stoxx Europe 600 (Europe) |
7.7 |
| Stoxx Europe 50 (Europe) |
5.6 |
| Euro Stoxx 50 (Euro zone) |
6.5 |
| Euro Stoxx (Euro zone) |
10.1 |
| ATX (Austria) |
30.6 |
| Bel-20 (Belgium) |
10.3 |
| PX 50 (Czech Republic) |
17.0 |
| OMX Copenhagen (Denmark) |
16.1 |
| OMX Helsinki (Finland) |
6.4 |
| CAC 40 (France) |
9.3 |
| DAX (Germany) |
12.5 |
| BUX (Hungary) |
23.0 |
| FTSE MIB (Italy) |
13.6 |
| AEX (Netherlands) |
12.7 |
| All-Shares (Norway) |
18.6 |
| WIG (Poland) |
23.2 |
| PSI 20 (Portugal) |
15.2 |
| RTS Index (Russia) |
0.2 |
| IBEX 35 (Spain) |
7.4 |
| SX All Share (Sweden) |
6.4 |
| Swiss Market (Switzerland) |
14.1 |
| BIST 100 (Turkey) |
47.6 |
| FTSE 100 (U.K.) |
7.6 |
| FTSE 250 (U.K.) |
14.7 |
| Americas |
| DJ Americas (Americas) |
18.8 |
| Merval (Argentina) |
77.7 |
| Sao Paulo Bovespa (Brazil) |
26.9 |
| S&P/TSX Comp (Canada) |
6.0 |
| Santiago IPSA (Chile) |
30.6 |
| IPC All-Share (Mexico) |
8.1 |
| Other Countries |
| Tel Aviv (Israel) |
2.8 |
| Johannesburg All Share (South Africa) |
17.5 |
Source: SIX Financial Information; WSJ Market Data Group
Key MSCI indexes illustrate the upbeat mood in global markets. A weaker dollar sweetened returns for U.S. investors.
| Table 6: Other Global Indexes |
| Index |
1-year in USD |
1-year in local currencies |
| MSCI EAFE |
21.8% |
12.2% |
| MSCI World |
20.1 |
16.3 |
| MSCI World Ex-USA |
21.0 |
11.7 |
| MSCI Emerging Markets |
34.4 |
27.8 |
Source: MSCI.com
Style—large caps come out on top as growth leads the way
An improving U.S. and global economy and a bullish psychology propelled growth funds in 2017. Immediately, the so-called FAANG stocks come to mind. In fact, the S&P 500 Growth Index includes Apple, Facebook, Amazon, and Alphabet (Google). Though not a FAANG stock, shares of Microsoft, which had a strong year, are also a part of the growth index.
Not surprisingly, equity income funds, which include a healthy fixed income component, lagged all-stock funds.
In most cases, international took the lead in 2017, outpacing U.S. funds.
Is a shift in global leadership underway? It’s too soon to say, but values are more reasonable in many international markets. If we are seeing a shift, keep in mind that cycles sometimes last for several years.
| Table 7: Style Annualized performance |
| |
Annualized |
| Investment Objective |
1-year |
3-year |
5-year |
10-year |
| Large-Cap Core Funds |
20.65% |
9.81% |
14.26% |
7.50% |
| Large-Cap Growth Funds |
29.58 |
11.67 |
15.7 |
8.44 |
| Large-Cap Value Funds |
15.85 |
8.46 |
13.34 |
6.56 |
| Mid-Cap Core Funds |
15.75 |
8.35 |
13.23 |
7.79 |
| Mid-Cap Growth Funds |
24.66 |
9.51 |
13.82 |
7.67 |
| Mid-Cap Value Funds |
12.93 |
7.89 |
13.12 |
7.99 |
| Small-Cap Core Funds |
12.56 |
8.92 |
13.01 |
8.21 |
| Small-Cap Growth Funds |
23.16 |
9.68 |
13.83 |
8.31 |
| Small-Cap Value Funds |
8.97 |
8.05 |
12.00 |
7.98 |
| Multi-Cap Core Funds |
19.46 |
8.90 |
13.74 |
7.13 |
| Multi-Cap Growth Funds |
28.04 |
10.42 |
14.82 |
8.13 |
| Multi-Cap Value Funds |
15.28 |
8.18 |
13.3 |
6.84 |
| Equity Income Funds |
15.45 |
8.24 |
12.31 |
6.99 |
| S&P 500 Funds |
21.51 |
10.94 |
15.21 |
7.95 |
| Sector/Specialty Funds |
| Specialty Diversified Equity |
10.04 |
-0.20 |
-3.06 |
-3.91 |
| Balanced Funds |
13.41 |
6.05 |
8.04 |
5.20 |
| Stock/Bond Blend Funds |
13.16 |
5.57 |
7.02 |
4.76 |
| All USDE Funds |
18.26 |
8.46 |
12.73 |
6.89 |
| Science & Technology Funds |
32.43 |
14.45 |
17.19 |
9.25 |
| Telecommunication Funds |
9.91 |
7.14 |
9.49 |
3.67 |
| Health/Biotechnology Funds |
25.82 |
6.70 |
18.23 |
12.49 |
| Utility Funds |
12.99 |
5.30 |
10.16 |
4.98 |
| Natural Resources Funds |
-2.57 |
-2.74 |
-0.67 |
-2.19 |
| Sector Funds |
7.62 |
4.81 |
7.96 |
6.30 |
| Real Estate Funds |
6.02 |
4.92 |
8.46 |
6.79 |
| Financial Services Funds |
15.49 |
11.43 |
15.05 |
5.14 |
| Gold Oriented Funds |
8.38 |
8.46 |
-10.39 |
-4.43 |
| Global Funds |
| Global Funds |
23.75 |
8.81 |
10.77 |
4.74 |
| International Stock Funds |
26.79 |
7.90 |
7.42 |
2.01 |
| European Region Funds |
24.49 |
7.80 |
8.01 |
1.79 |
| Emerging-Markets Funds |
34.57 |
7.98 |
4.26 |
1.49 |
| Latin American Funds |
28.17 |
4.69 |
-3.04 |
-1.73 |
| Pacific Region Funds |
37.60 |
11.19 |
9.24 |
3.81 |
| Bond Funds |
| Short-Term Bond Funds |
1.66 |
1.31 |
1.01 |
2.17 |
| Long-Term Bond Funds |
5.82 |
3.27 |
3.06 |
5.02 |
| Intermediate Bond Funds |
3.56 |
2.15 |
1.95 |
3.83 |
| Intermediate U.S. Funds |
2.25 |
1.46 |
0.02 |
2.67 |
| Short-Term U.S. Funds |
3.56 |
2.15 |
1.95 |
3.83 |
| Long-Term U.S. Funds |
2.90 |
1.15 |
1.21 |
3.49 |
| General U.S. Taxable Funds |
5.50 |
2.83 |
3.35 |
5.37 |
| High-Yield Taxable Funds |
6.58 |
5.00 |
4.63 |
6.42 |
| Mortgage Funds |
2.25 |
1.56 |
1.63 |
3.58 |
| World Bond Funds |
7.82 |
3.03 |
1.04 |
3.64 |
| All Taxable Bond Funds |
4.23 |
2.58 |
2.11 |
3.84 |
| Short-Term Muni Funds |
0.66 |
0.51 |
0.33 |
1.39 |
| Intermediate Muni Funds |
4.04 |
1.98 |
1.95 |
3.39 |
| General & Insured Muni Funds |
5.41 |
2.81 |
2.80 |
4.04 |
| High-Yield Municipal Funds |
7.79 |
4.27 |
4.07 |
4.42 |
| Barclays Muni Bond |
5.45 |
2.98 |
3.02 |
4.46 |
| Barclays Aggregate Bond |
3.54 |
2.24 |
2.10 |
4.01 |
| DJ Corp Bond TR IX |
5.99 |
3.84 |
3.52 |
6.41 |
| Miscellaneous |
| DJ Ind Dly Reinv Avg IX |
28.11 |
14.36 |
16.37 |
9.28 |
| DJ U.S. TSM Growth |
26.95 |
11.94 |
16.76 |
n/a |
| DJ U.S. Total Stock Market |
21.17 |
11.08 |
15.52 |
n/a |
| DJ U.S. TSM Value |
15.88 |
10.24 |
14.30 |
n/a |
| Dow Jones Global Ex U.S. Tr |
27.68 |
8.45 |
7.43 |
2.40 |
| MSCI EAFE IX ID |
21.78 |
4.93 |
5.04 |
-0.94 |
| Russell 2000 TR IX |
14.65 |
9.96 |
14.12 |
8.71 |
| Russell 3000 TR IX |
21.13 |
11.12 |
15.58 |
8.60 |
| S&P 500 Daily Reinv IX |
21.83 |
11.41 |
15.79 |
8.50 |
| S&P Sm Cap 600 TR IX |
13.23 |
12.00 |
15.99 |
10.43 |
| S&P Midcap 400 TR IX |
16.24 |
11.14 |
15.01 |
9.97 |
| T-Bill Month TR IX |
0.92 |
0.43 |
0.27 |
0.32 |
| Managed Futures Funds |
3.55 |
-0.58 |
2.59 |
-1.83 |
| Emerging-Market Local-Currency Debt Funds |
14.45 |
2.08 |
-1.89 |
2.89 |
| Global Equity Income Funds |
17.04 |
6.72 |
8.69 |
3.42 |
| International Equity Income Funds |
22.48 |
5.82 |
4.97 |
1.44 |
| Mixed-Asset Target Today Funds |
9.06 |
4.11 |
4.30 |
4.08 |
Source: Lipper; WSJ Market Data Group
Performance numbers are total return (changes in net asset values with reinvested distributions) for the periods ended Dec. 29. All performance numbers are final.
Stubbornly low bond yields
The Fed raised rates three times in 2017—March, June, and December. If we could choose to start the calendar in December, we could argue four rate hikes—December 2016—December 2017. The Fed also announced it will gradually allow bonds acquired under QE to slowly run off its balance sheet.
Short-term yields dutifully turned higher, which would be expected following rate increases. But long-term yields refused to cooperate.
Note the decline in the yield curve. It’s something that is likely to get plenty of attention this year, as a flat or inverted yield curve has historically preceded a recession.
Why have long-term bond yields remained stubbornly low, even as the economic expansion is among the longest since WWII?
Low U.S. inflation, sluggish U.S. and global growth through much of the expansion, accommodative global central banks, and rock bottom bond yields in many developed nations are cited as the most likely reasons.
| Table 8: Treasury Rates—End of Month |
| |
3-month T-bill |
2-year Treasury yield |
10-year Treasury yield |
30-year Treasury yield |
10-year minus 2-year yield (yield curve) |
| Jan 2017 |
0.52% |
1.19% |
2.45% |
3.05% |
1.26% |
| Feb |
0.53 |
1.22 |
2.36 |
2.97 |
1.14 |
| Mar |
0.75 |
1.27 |
2.40 |
3.02 |
1.13 |
| Apr |
0.79 |
1.28 |
2.29 |
2.96 |
1.01 |
| May |
0.96 |
1.28 |
2.21 |
2.87 |
0.93 |
| Jun |
1.01 |
1.38 |
2.31 |
2.84 |
0.93 |
| Jul |
1.05 |
1.34 |
2.30 |
2.89 |
0.96 |
| Aug |
0.99 |
1.33 |
2.12 |
2.73 |
0.79 |
| Sep |
1.04 |
1.47 |
2.33 |
2.86 |
0.86 |
| Oct |
1.13 |
1.60 |
2.38 |
2.88 |
0.78 |
| Nov |
1.25 |
1.78 |
2.42 |
2.83 |
0.64 |
| Dec |
1.37 |
1.89 |
2.40 |
2.74 |
0.51 |
Source: St. Louis Federal Reserve
Corporates—quality and junk
Much as we saw in Treasuries, corporates and high-yield debt were reasonably stable through much of the year.
Of course, when it comes to junk debt and “reasonably stable,” I must add the caveat that everything is relative.
By their nature, junk bonds are speculative and experience bouts of volatility. Sentiment can temporarily shift or a sector may hit a rough patch. Any U.S. economic tremors are quickly amplified in the junk bond market.
Longer term, a growing economy has historically been supportive of high-yield debt. But junk also acts as the recessionary “canary in the coal mine,” as investors will quickly bail out of the riskiest assets when economic conditions soften.
Today, however, the spread between junk bond yields and Treasuries are quite low, underscoring the overall confidence investors have in the economy. What, me worry? That’s the message from the high-yield debt market.
| Table 9: Bank of America Merrill Lynch U.S. Corporate Effective Yield—End of Month |
| |
AA |
A |
BBB |
BB |
B |
CCC or below |
| Jan 2017 |
2.75% |
3.10% |
3.76% |
4.64% |
5.88% |
10.60% |
| Feb |
2.68 |
3.02 |
3.66 |
4.47 |
5.60 |
9.83 |
| Mar |
2.74 |
3.08 |
3.73 |
4.55 |
5.88 |
10.37 |
| Apr |
2.68 |
3.01 |
3.63 |
4.31 |
5.65 |
10.30 |
| May |
2.63 |
2.92 |
3.53 |
4.22 |
5.53 |
10.03 |
| Jun |
2.69 |
2.96 |
3.57 |
4.29 |
5.73 |
10.56 |
| Jul |
2.62 |
2.89 |
3.48 |
4.14 |
5.47 |
10.20 |
| Aug |
2.55 |
2.82 |
3.44 |
4.17 |
5.59 |
10.62 |
| Sep |
2.67 |
2.93 |
3.51 |
4.12 |
5.54 |
10.34 |
| Oct |
2.68 |
2.94 |
3.51 |
4.15 |
5.49 |
10.53 |
| Nov |
2.78 |
3.06 |
3.62 |
4.28 |
5.84 |
10.81 |
| Dec |
2.78 |
3.04 |
3.59 |
4.42 |
5.90 |
10.53 |
Source: St. Louis Federal Reserve; ‘BBB’ is the lowest grade of investment debt
Oil bubbles up
West Texas Intermediate crude oil rose above $60 per barrel for the first time since June 2015. An improving global economy and production cutbacks from OPEC are whittling away at the global surplus in oil inventories.
In addition, firms specializing in fracking in the U.S. shale fields have been more disciplined recently, focusing on profitability rather than an all-out desire to drill for new supplies. Outside geopolitical events, the perception of how quickly new shale may come online is likely to play a big role in what happens to oil prices in the coming year.
Elsewhere, the CRB Index, which is a broad measure of commodities, managed to rally off midyear lows, but have yet to decisively breakout of a bear market.
Gold prices finished the year higher, but the dollar failed to take its cues from Fed rate hikes and ended the year lower.
| Table 10: Key Commodities/Indexes |
| |
Dec 30, 2016 |
Dec 29, 2017 |
| WTI Crude Spot Price |
$53.75/barrel |
$60.46/barrel |
| Gold–London Fixing |
1,159.10/oz |
1,296.50/oz |
| Dollar Index–Major Currencies |
95.72 |
87.47 |
| Dollar Index–Broad |
128.21 |
119.07 |
| Thomson Reuters/ CoreCommodity CRB Index |
192.51 |
193.86 |
Source: St. Louis Federal Reserve, Bloomberg
GDP shows promise
It’s been a lackluster economic recovery since the recession ended in 2009. We briefly experienced a spurt of growth in 2014, but the economy quickly re-entered its low-growth orbit.
Turn the page to 2017. Q2 and Q3 saw growth above 3%, the first such consecutive streak in three years.
Consumer and business confidence are higher, and there is cautious optimism that recent tax cuts will inject a fresh round of stimulus into the economy as we head into 2018.
Figure 1: U.S. Economic Output
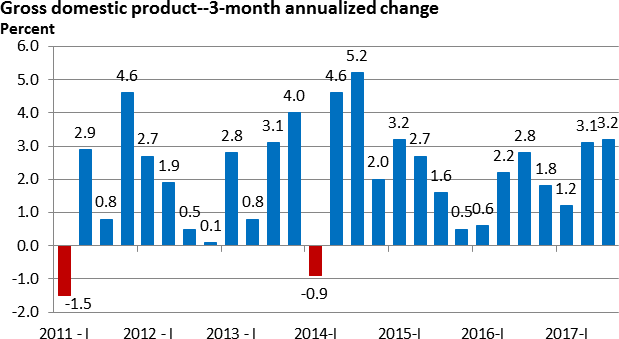
Source: Bureau of Economic Analysis; Last date: Q3 2017
Payroll growth
Job growth has historically been the byproduct of economic growth, and 2017 was no exception.
While growth in nonfarm payrolls has moderated from 2016 (average of 190,000 per month in 2016 versus 171,000 per month in 2017), job growth cut the unemployment rate to 4.1% by year end.
| Table 11: Key Labor Market Indicators |
| |
Nonfarm payrolls (000s) |
Unemployment rate (%) |
| Jan 2017 |
216 |
4.8 |
| Feb |
232 |
4.7 |
| Mar |
50 |
4.5 |
| Apr |
207 |
4.4 |
| May |
145 |
4.3 |
| Jun |
210 |
4.3 |
| Jul |
138 |
4.3 |
| Aug |
208 |
4.4 |
| Sep |
38 |
4.2 |
| Oct |
211 |
4.1 |
| Nov |
252 |
4.1 |
| Dec |
148 |
4.1 |
Source: Bureau of Labor Statistics
Nonfarm payrolls will be subject to revisions with the release of Jan. 2018 data.
Inflation surprise
There are two key pricing gauges of retail inflation that investors follow closely—the Consumer Price Index (CPI) and the Personal Consumption Expenditures Price Index (PCE Price Index).
Both are broad-based measures. The Fed favors the PCE Price Index.
The core CPI, which does not include food and energy, unexpectedly slowed in 2017. The Fed blamed transitory factors for the weakness in core inflation.
Although there are outlying concerns that low inflation could persist, the Fed is reasonably confident that prices will gradually move back to its 2% target as 2018 progresses.
Figure 2: Pricing Pressures
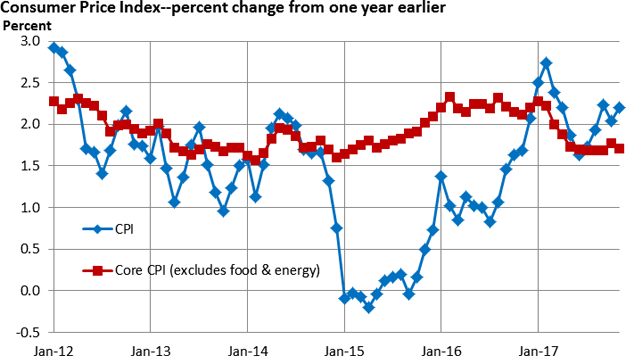
Source: St. Louis Federal Reserve; Last date: Nov. 2017
The Fed-favored inflation gauge
The headline and the core PCE Price Index have been below the Fed’s 2% target since early 2012.
Like the CPI, the headline PCE has accelerated thanks to the uptick in oil prices. Unlike the CPI, core inflation remains below the Fed’s 2% target.
Like the CPI, the core PCE Price Index registered an unexpected slowdown last year, but it gradually began to creep higher as the year came to a close.
Historically, the PCE Price Index has tended to register at levels that are slightly below the CPI.
Figure 3: The Fed-Favored Inflation Measure
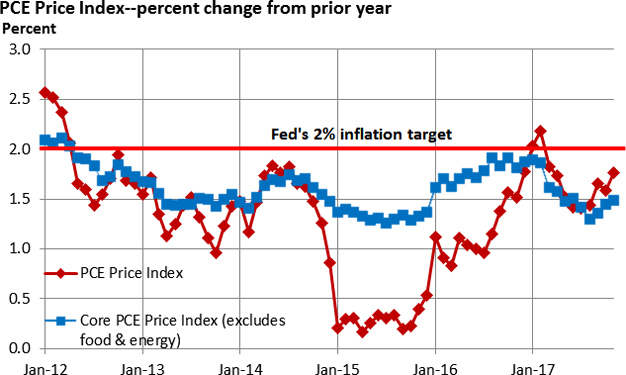
Source: St. Louis Federal Reserve; Last date: Nov. 2017