Editor’s note: For 2018, our Top 10 most popular articles of the year show that advisors were especially interested in the impact of the new tax law, the changing landscape for advisor fees, and new technology. Rounding out the crop were perennial topics touching on professionalism, client service, and effective marketing. From more than 500 articles published this year, Horsesmouth members rated this as one of the best.
One of the biggest criticisms of the AUM business model is that when financial advisor fees are 1% (or some other percentage) of the portfolio, that the advisor will get paid twice as much money to manage a $2M portfolio than a $1M portfolio—despite the reality that it won’t likely take twice as much time and effort and work to serve the $2M client compared to the $1M client. To some extent, there may be a little more complexity involved for the more affluent client, and it may be a little harder to market and get the $2M client, and there may be some greater liability exposure (given the larger dollar amounts involved if something goes wrong), but not necessarily at a 2:1 ratio for the client with double the account size.
Yet traditionally, the AUM business has long been a “volume-based” business, where larger portfolios reach “breakpoints” where the marginal fees get lower as the dollar amounts get bigger. For instance: the advisor who charges 1% on the first $1M, but “only” 0.50% on the next $1M, such that the client with double the assets does pay 50% more (in recognition of the costs to market, additional service complexity, and the liability exposure), but not double.
However, this means that the “typical financial advisor fee” of 1% is somewhat misleading, as while it may be true that the average financial advisory fee is 1% for a particular portfolio size, the fact that fees tend to decline as account balances grow (and may be higher for smaller accounts) means the commonly cited 1% fee fails to convey the true sense of the typical graduated fee schedule of a financial advisor.
Fortunately, though, recent research by Bob Veres’s Inside Information, in a survey of nearly 1,000 advisors, shines a fresh light on how financial advisors typically set their AUM fee schedules, not just at the mid-point, but up and down the scale for both smaller and larger account balances. And as Veres’s research finds, the median advisory fee up to $1M of assets under management really is 1%. However, many advisors charge more than 1% (especially on “smaller” account balances), and often substantially less for larger dollar amounts, with most advisors incrementing fees by 0.25% at a time (e.g., 1.25%, 1.00%, 0.75%, and 0.50%), as shown in the chart below.
Figure 1: Distribution of financial advisor AUM fees by portfolio size
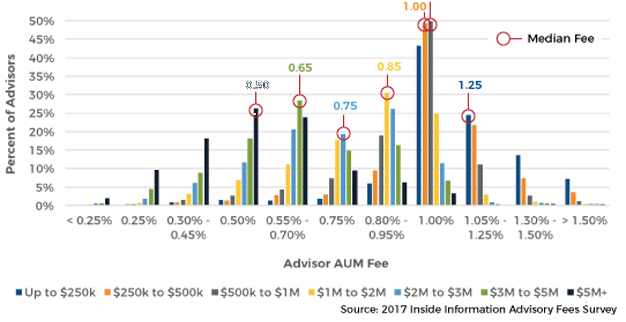
Source: Michael Kitces at Kitces.com&v=iirlgxr5vnpjv35mfputt1gb
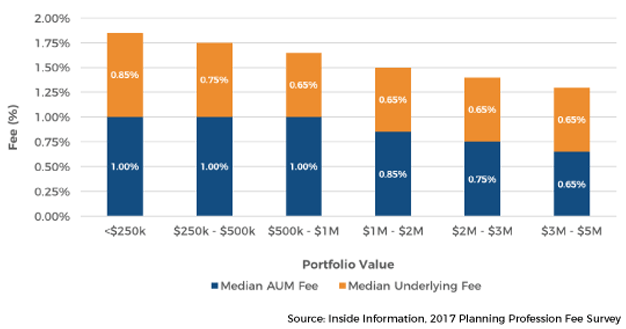
More generally, though, Veres’s research affirms that the median AUM fee really does decline as assets rise. At the lower end of the spectrum, the typical financial advisory fee is 1% all the way up to $1M (although notably, a substantial number of advisors charge more than 1%, particularly for clients with portfolios of less than $250k, where the median fee is almost 1.25%). However, the median fee drops to 0.85% for those with portfolios over $1M. And as the dollar amounts rise further, the median investment management fee declines further, to 0.75% over $2M, 0.65% over $3M, and 0.50% for over $5M (with more than 10% of advisors charging just 0.25% or less).
Notably, because these are the stated advisory fees at specific breakpoints, the blended fees of financial advisors at these dollar amounts would still be slightly higher. For instance, the median advisory fee at $2M might be 0.85%, but if the advisor really charged 1.25% on the first $250k, 1% on the next $750k, and 0.85% on the next $1M after that, the blended fee on a $2M portfolio would actually be 0.96% at $2M.
Nonetheless, the point remains: As portfolio account balances grow, advisory fees decline, and the “typical” 1% AUM fee is really just a typical (marginal) fee for portfolios around a size of $1M. Those who work with smaller clients tend to charge more, and those who work with larger clients tend to charge less.
Figure 2: Median AUM fee schedules based on portfolio AUM
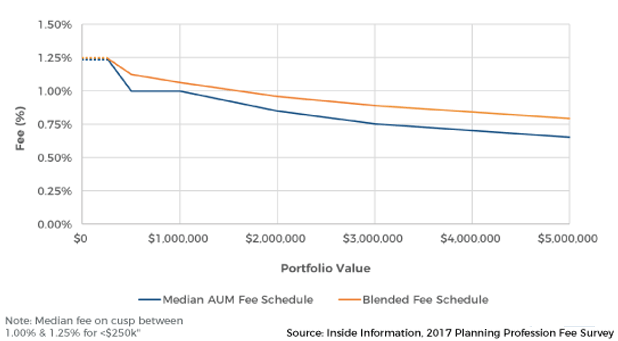
Source: Michael Kitces at Kitces.com&v=iirlgxr5vnpjv35mfputt1gb
How much do financial advisors cost in all-in fees?
The caveat to this analysis, though, is that it doesn’t actually include the underlying expense ratios of the investment vehicles being purchased by financial advisors on behalf of their clients.
Of course, for those who purchase individual stocks and bonds, there are no underlying wrapper fees for the underlying investments. However, the recent FPA 2017 Trends In Investments Survey of Financial Advisors finds that the overwhelming majority of financial advisors use at least some mutual funds or ETFs in their client portfolios (at 88% and 80%, respectively), which would entail additional costs beyond just the advisory fee itself.
Figure 3: Advisor use of investment products with clients over time
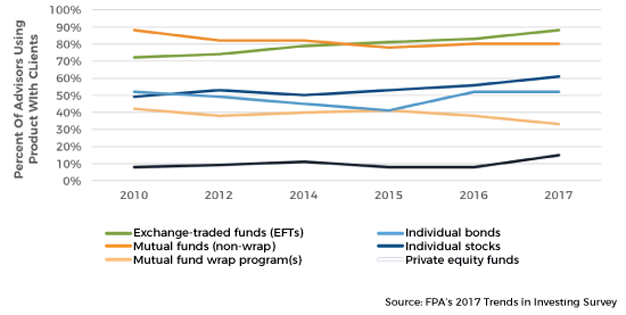
Source: Michael Kitces at Kitces.com&v=iirlgxr5vnpjv35mfputt1gb
Fortunately, though, the Veres study did survey not only advisors’ own AUM fee schedules but also the expense ratios of the underlying investments they used to construct their portfolios. And as the results reveal, the underlying expense ratios add a non-trivial total all-in cost to the typical financial advisory fee, with the bulk of blended expense ratios coming in between 0.20% and 0.75% (and a median of 0.50%).
Figure 4: Average blended expense ratio of investments used by financial advisors
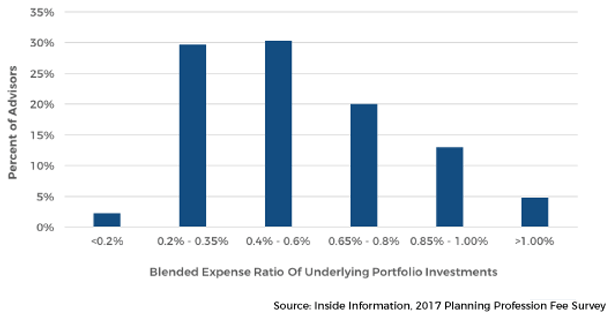
Source: Michael Kitces at Kitces.com&v=iirlgxr5vnpjv35mfputt1gb
Of course, when it comes to ETFs, as well as the advisors who trade individual stocks and bonds, there are also underlying transaction costs to consider. Fortunately, given the size of typical advisor portfolios, and the ever-declining ticket charges for stock and ETF trades, the cumulative impact is fairly modest. Still, while most advisors estimated their trading costs at just 0.05%/year or so, with almost 15% at 0.02% or less, there were another 18% of advisors with trading costs of 0.10%/year, almost 10% up to 0.20%/year, and 6% that trade more actively (or have smaller typical client account sizes where fixed ticket charges consume a larger portion of the account) and estimate cumulative transaction costs even higher than 0.20%/year.
In addition, the reality is that a number of financial advisors work with advisory platforms that separately charge a platform fee, which in some cases covers both technology and platform services and also an all-in wrap fee on trading costs (and/or access to a No-Transaction-Fee [NTF] platform with a platform wrapper cost). Amongst the more-than-20% of advisors who reported paying such fees (either directly or charged to their clients), the median fee was 0.20%/year.
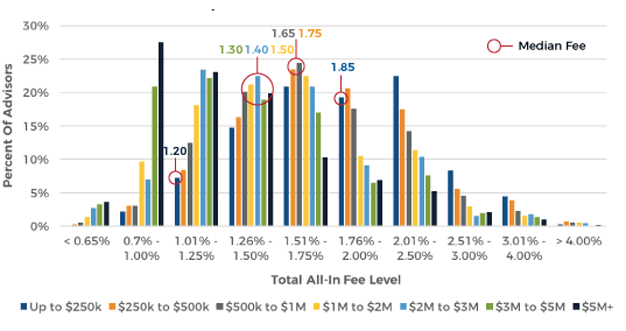
Accordingly, once all of these various underlying costs are packaged together, it turns out that the all-in costs for financial advisors—even and including fee-only advisors, which comprised the majority of Veres’s data set—including the total cost of AUM fees, plus underlying expense ratios, plus trading and/or platform fees, are a good bit higher than the commonly reported 1% fee.
For instance, the median all-in cost of a financial advisor serving under-$250k portfolios was actually 1.85%, dropping to 1.75% for portfolios up to $500k, 1.65% up to $1M, and 1.5% for portfolios over $1M, dropping to $1.4% over $2M, 1.3% over $3M, and 1.2% over $5M.
Figure 5: Distribution of financial advisor all-in fees by portfolio size
Source: Michael Kitces at Kitces.com&v=iirlgxr5vnpjv35mfputt1gb
Notably, though, the decline in all-in costs as assets rise moves remarkably in-line with the advisor’s underlying fee schedule, suggesting that the advisor’s “underlying” investments and platform fee are actually remarkably stable across the spectrum.
For instance, the median all-in cost for “small” clients was 1.85% versus an AUM fee of 1% (although the median fee was “almost” 1.25% in Veres’s data) for a difference of 0.60%—0.85%, larger clients over $1M face an all-in cost of 1.5% versus an AUM fee of 0.85% (a difference of 0.65%), and even for $5M+ the typical total all-in cost was 1.2% versus a median AUM fee of 0.5% (a difference of 0.70%). Which means the total cost of underlying trading fees, expense ratios, and the rest is relatively static, at around 0.60% to 0.70% for advisors across the spectrum!
Figure 6: Median all-in AUM fees of financial advisers (by portfolio size)
Source: Michael Kitces at Kitces.com&v=iirlgxr5vnpjv35mfputt1gb
On the one hand, it’s somewhat surprising that as client account sizes grow, advisors reduce their fees, but platform fees and underlying expense ratios do not decrease. On the other hand, it is perhaps not so surprising given that most mutual funds and ETFs don’t actually have expense ratio breakpoints based on the amount invested, especially as an increasing number of low-cost no-load and institutional-class shares are available to RIAs (and soon, “clean shares” for broker-dealers) regardless of asset size.
It’s also notable that at least some advisor platforms do indirectly “rebate” back a portion of platform and underlying fees, in the form of better payouts (for broker-dealers), soft dollar concessions (for RIAs), and other indirect financial benefits (e.g., discounted or free software, higher-tier service teams, access to conferences, etc.) that reduce the advisor’s costs and allows the advisor to reduce their AUM fees. Which means indirectly, platforms fees likely do get at least a little cheaper as account sizes rise (or at least, as the overall size of the advisory firm rises). It’s simply expressed as a full platform charge, with a portion of the cost rebated to the advisor, which in turn allows the advisor to pass through the discount by reducing their own AUM fee successfully.
Fee schedules: Investment management fees or financial planning fees?
One of the other notable trends of financial advisory fees in recent years is that financial advisors have been compelled to do more and more to justify their fees, resulting in a deepening in the amount of financial planning services provided to clients for that same AUM fee, and a concomitant decline in the profit margins of advisory firms.
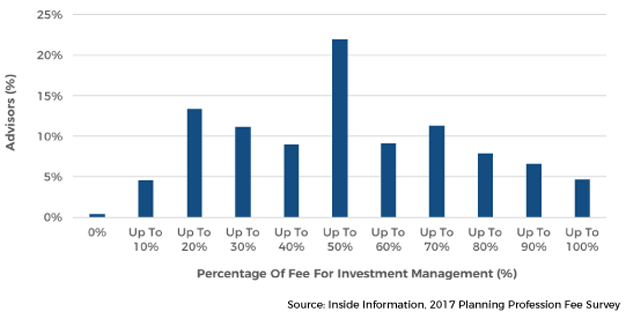
To clarify how financial advisors position their AUM fees, the Veres study also surveyed how advisors allocate their own AUM fees between investment management and non-investment-management (i.e., financial planning, wealth management, and other) services.
Not surprisingly, barely 5% of financial advisors reported that their entire AUM fee is really just an investment management fee for the portfolio, and 80% of advisors who reported that at least 90% of their AUM fee was “only” for investment management stated it was simply because they were charging a separate financial planning fee anyway.
For most advisors who do bundle together financial planning and investment management, though, the Veres study found that most commonly advisors claim their AUM fee is an even split between investment management services, and non-investment services that are simply paid for via an AUM fee. In other words, the typical 1% AUM fee is really more of a 0.50% investment management fee plus a 0.50% financial planning fee.
Figure 7: Self-reported percentage of advisor’s AUM fee actually paying for investment management
Source: Michael Kitces at Kitces.com&v=iirlgxr5vnpjv35mfputt1gb
Perhaps most striking, though, is that there’s almost no common consensus or industry standard about how much of an advisor’s AUM fee should really be an investment management fee versus not, despite the common use of a wide range of labels like “financial advisor”, “financial planner”, “wealth manager”, etc.
As noted earlier, in part this may be because a subset of those advisors in the Veres study are simply charging separately for financial planning, which increases the percentage-of-AUM-fee-for-just-investment-management allocation (since the planning is covered by the planning fee). Nonetheless, the fact that 90% of advisors still claim their AUM fees are no-more-than-90% allocable to investment management services suggests the majority of advisors package at least some non-investment value-adds into their investment management fee. Yet how much is packaged in and bundled together varies tremendously!
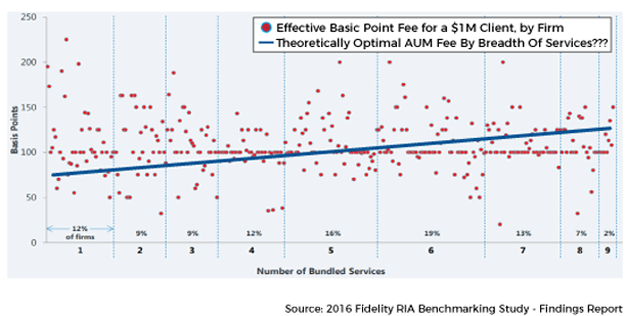
More broadly, though, this ambiguity about whether or how much value financial advisors provide, beyond investment management, for a single AUM fee, is not unique to the Veres study. For instance, last year’s 2016 Fidelity RIA Benchmarking Study found that there is virtually no relationship between an advisor’s fees for a $1M client and the breadth of services the advisor actually offers to that client! In theory, as the breadth of services to the client rises, the advisory fee should rise as well to support those additional value-adds. Instead, though, the Fidelity study found that the median advisory fee of 1% remains throughout, regardless of whether the advisor just offers wealth management, or bundles together 5 or even 9 other supporting services!
Figure 8: Self-reported advisory fees on $1M portfolio, by number of bundled services
Source: Michael Kitces at Kitces.com&v=iirlgxr5vnpjv35mfputt1gb
The future of fee compression: Investment management, financial planning, products, and platforms
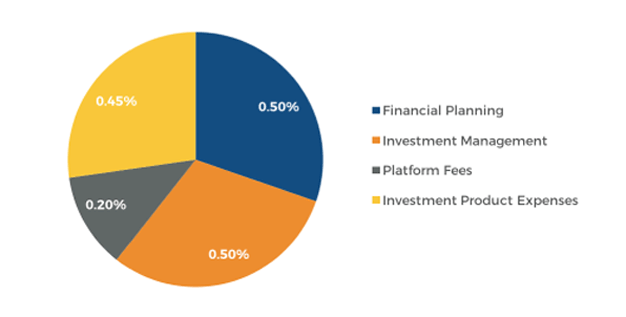
Overall, what the Veres study suggests is that the typical all-in AUM fee to work with a financial advisor is actually broken up into several component parts. For a total-cost AUM fee of 1.65% for a portfolio up to $1M, this includes an advisory fee of 1% (which in turn is split between financial planning and investment management), plus another 0.65% of underlying expenses (which is split between the underlying investment products and platform). Which means a financial advisor’s all-in costs really need to be considered across all four domains: investment management, financial planning, products, and platform fees.
Figure 9: Breakdown of typical financial advisor’s all-in costs
Source: Michael Kitces at Kitces.com&v=iirlgxr5vnpjv35mfputt1gb
Notably, how the underlying costs come together may vary significantly from one advisor to the next. Some may use lower-cost ETFs but have slightly higher trading fees (given ETF ticket charges) from their platforms. Others may use mutual funds that have no transaction costs but indirectly pay a 0.25% platform fee (in the form of 12b-1 fees paid to the platform). Some may use more expensive mutual funds but trim their own advisory fees. Others may manage individual stocks and bonds but charge more for their investment management services. A TAMP may combine together the platform and product fees.
Overall, though, the Veres data reveals that the breadth of all-in costs is even wider than the breadth of AUM fees, suggesting that financial advisors are finding more consumer sensitivity to their advisory fees and less sensitivity to the underlying platform and product costs. On the other hand, the rising trend of financial advisors using ETFs to actively manage portfolios suggests that advisors are trying to combat any sensitivity to their advisory fees by squeezing the costs out of their underlying portfolios instead (i.e., by using lower-cost ETFs instead of actively managed mutual funds, and taking over the investment management fee of the mutual fund manager themselves).
In turn, we can consider the potential implications of fee compression by looking across each of the core domains: investment management, financial planning, and what is typically a combination of products and platform fees.
When it comes to investment management fees, the fact that the typical financial advisor already allocates only half of their advisory fee to investment management (albeit with a wide variance) suggests that there may actually not be much fee compression looming for financial advisors. After all, if the advisor’s typical AUM fee is 1% but only half of that—or 0.50%—is for investment management, then the fee isn’t that far off from many of the recently launched robo-advisors, including TD Ameritrade Essential Portfolios (0.30% AUM fee), Fidelity Go (0.35% AUM fee), and Merrill Lynch Guided Edge (0.45% AUM fee). At worst, the fee compression risk for pure investment management services may “only” be 20 basis points anyway. And for larger clients—where the fee schedule is falling to 0.50% anyway, and the investment management portion would be only 0.25%—financial advisors have already converged on “robo” pricing.
On the other hand, with the financial planning portion of fees, there appears to be little fee compression at all. In fact, as the Fidelity benchmarking study shows, consumers (and advisors) appear to be struggling greatly to assign a clear value to financial planning services at all. Not to say that financial planning services aren’t valuable, but that there’s no clear consensus on how to value them effectively, such that firms provide a wildly different range of supporting financial planning services for substantially similar fees. Until consumers can more clearly identify and understand the differences in financial planning services between advisors, and then “comparison-shop” those prices, it’s difficult for financial planning fee compression to take hold.
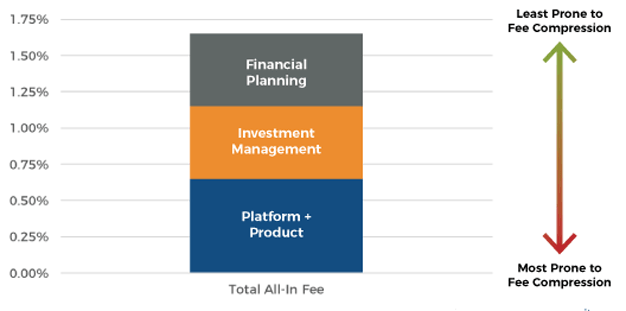
By contrast, fee compression for the combination of platforms and the underlying product expenses appears to be most ripe for disruption. And arguably, the ongoing shift of financial advisors toward lower-cost product solutions suggests that this trend is already well underway, such that even as advisory firms continue to grow, the asset management industry in the aggregate saw a decline in both revenues and profits in 2016. And the trend may only accelerate if increasingly sophisticated rebalancing and model management software begins to create “Indexing 2.0” solutions that make it feasible to eliminate the ETF and mutual fund fee layer altogether. Similarly, the trend of financial advisors from broker-dealers to RIAs suggests that the total cost layer of broker-dealer platforms is also under pressure. And TAMPs that can’t get their all-in pricing below the 0.65% platform-plus-product fee will likely also face growing pressure.
Figure 10: Susceptibility of all-in fees to compression
Source: Michael Kitces at Kitces.com&v=iirlgxr5vnpjv35mfputt1gb
Notably, though, these trends also help to reveal the growing pressure for fiduciary regulation of financial advisors—because as the investment management and product/platform fees continue to shrink, and the relative contribution of financial planning services grow, the core of what a financial advisor “does” to earn their fees is changing, despite the fact that our financial advisor regulation is based primarily on the underlying investment products and services (and not fee-for-service financial planning advice).
Nonetheless, the point remains that financial advisor fee compression is at best a more nuanced story than is commonly told in the media today. To the extent financial advisors are feeling fee pressure, it appears to be resulting in a shift in the advisor value proposition to earn their 1% fee, and a drive to bring down the underlying costs of products and platforms to defend the advisor’s fee by trimming (other) components of the all-in cost instead. Though at the same time, the data suggests that consumers are less sensitive to all-in costs than “just” the advisor’s fee … raising the question of whether analyzing all-in costs for financial advice may become the next battleground issue for financial advisors that seek to differentiate their costs and value.
In the meantime, for any financial advisors who want to access Veres’s White Paper on Advisory Fees and survey results, you can request a free copy here.
So what do you think?
Do you think financial advisors’ investment management fees are pretty much in line with robo advisors already? Is fee compression more nuanced than typically believed? Please share your thoughts in the comments below!